Overspending on the cloud isn’t noticed by the development teams until finance highlights it, which is usually only after it’s been built up significantly.
This breakdown covers:
- Possible reasons for increased cloud costs
- A three lever framework to reduce cloud spend
- The proper sequence for rightsizing and commitment
- How AI workloads change normal cost assumptions
- When to build or buy for cloud solutions
No one likes explaining another cloud cost change and admitting that they do not know why. You will be forced to explain budget decisions made months earlier by engineers who were more concerned about delivering products than about managing costs.
The difference between engineering decisions and their financial implications is creating a need for improved cloud cost management. Global spending on cloud cost management is projected to grow from $6.2 billion in 2026 to $19.3 billion by 2033, according to Grand View Research, as enterprises look for better control.
For enterprises spending millions on AWS, Azure, or GCP, this is more than wasted spend. It affects control, predictability and confidence. It requires more than a dashboard to understand your cloud spending. You’ll first need to have a clear understanding of where your cloud spend is going.
It’s Not a Tooling Problem
Closing the cost gap isn’t about another tool. It comes down to three levers: usage efficiency, architecture choices and pricing models. Most teams only ever work on one.
Cloud Cost Optimization vs. Cost Management: Why the Difference Matters
Cloud cost optimization focuses on reducing unnecessary spending, while cost management focuses on tracking, planning and controlling it. Understanding both helps enterprises reduce waste without losing control over cloud budgets.
| Dimension | Cloud Cost Management | Cloud Cost Optimization |
| Core Question It Answers | “Where is our cloud budget actually going?” | “How can we become more efficient without compromising performance?” |
| Primary Goal | Track spend across teams and services. | Actively reducing spend by using the right resources at the best price. |
| Time Orientation | Ongoing track and report spend, generally monthly or in real time. | Actions taken continuously in response to changes |
| Key Activities | Includes tagging, budgeting, allocating, and setting spend limits | Taking action to rightsize/plan for reserved instances/clean up idle resources, modifying architecture |
| Typical Owner | Finance team, supported with data from the engineering team | Architects/Engineers, under the direction of FinOps |
| What Leadership Sees | Dashboards, Spend Report, Budget Variance Summary | Decreased cloud costs, improved unit economics, and increased efficiency |
| Business Impact If Done Well | Improved forecasting and reduced budget surprises | Actual savings, compounded and better margins on cloud dependent products |
| Risk If Ignored | Expenses increase without being noticed until finance detects them | The waste is visible but ignored, opportunities for savings missed |
| Relationship to FinOps | “Inform” stage, understanding how funds are utilized | The “Optimize/Operate” phase, taking action based on what has been seen |
| Board-Level Relevance | Increases forecasting accuracy in financial planning | Directly defends the margin, particularly for cloud based revenue lines |
Management and optimization go hand in hand. Visibility without results happens when management and optimization are separated. True savings happen when both management and optimization work together.
A Familiar Frustration
In one r/sysadmin thread, an engineer watched cloud spend climb past years of on premises costs, despite promises of faster development and openly wondered whether the benefit matched the bill.
What’s Really Driving Up Cloud Spend: Pricing, Ownership, and AI Workloads
Cloud expenses do not only increase with increased usage. Pricing options, unclear ownership, and changes in AI workloads may also increase cloud expenses without team realizing why.
- On-demand pricing by default: On most occasions, teams begin with on-demand pricing without ever changing it, even if the level of usage stabilizes enough to make more cost-effective commitments.
- Autoscaling without limits: Autoscaling may be able to deal with demand, but without set limitations, traffic bursts or job failures may incur higher costs.
- Unclear ownership: The Finance department manages the bills, while the Engineering department controls the resources. Without ownership of both, wasteful spending will be hard to identify.
- AI and ML workload changes: The nature of AI and ML workloads can make the work unpredictable. Traditional budgets may have a hard time managing the variety of costs.
Enterprise Insight
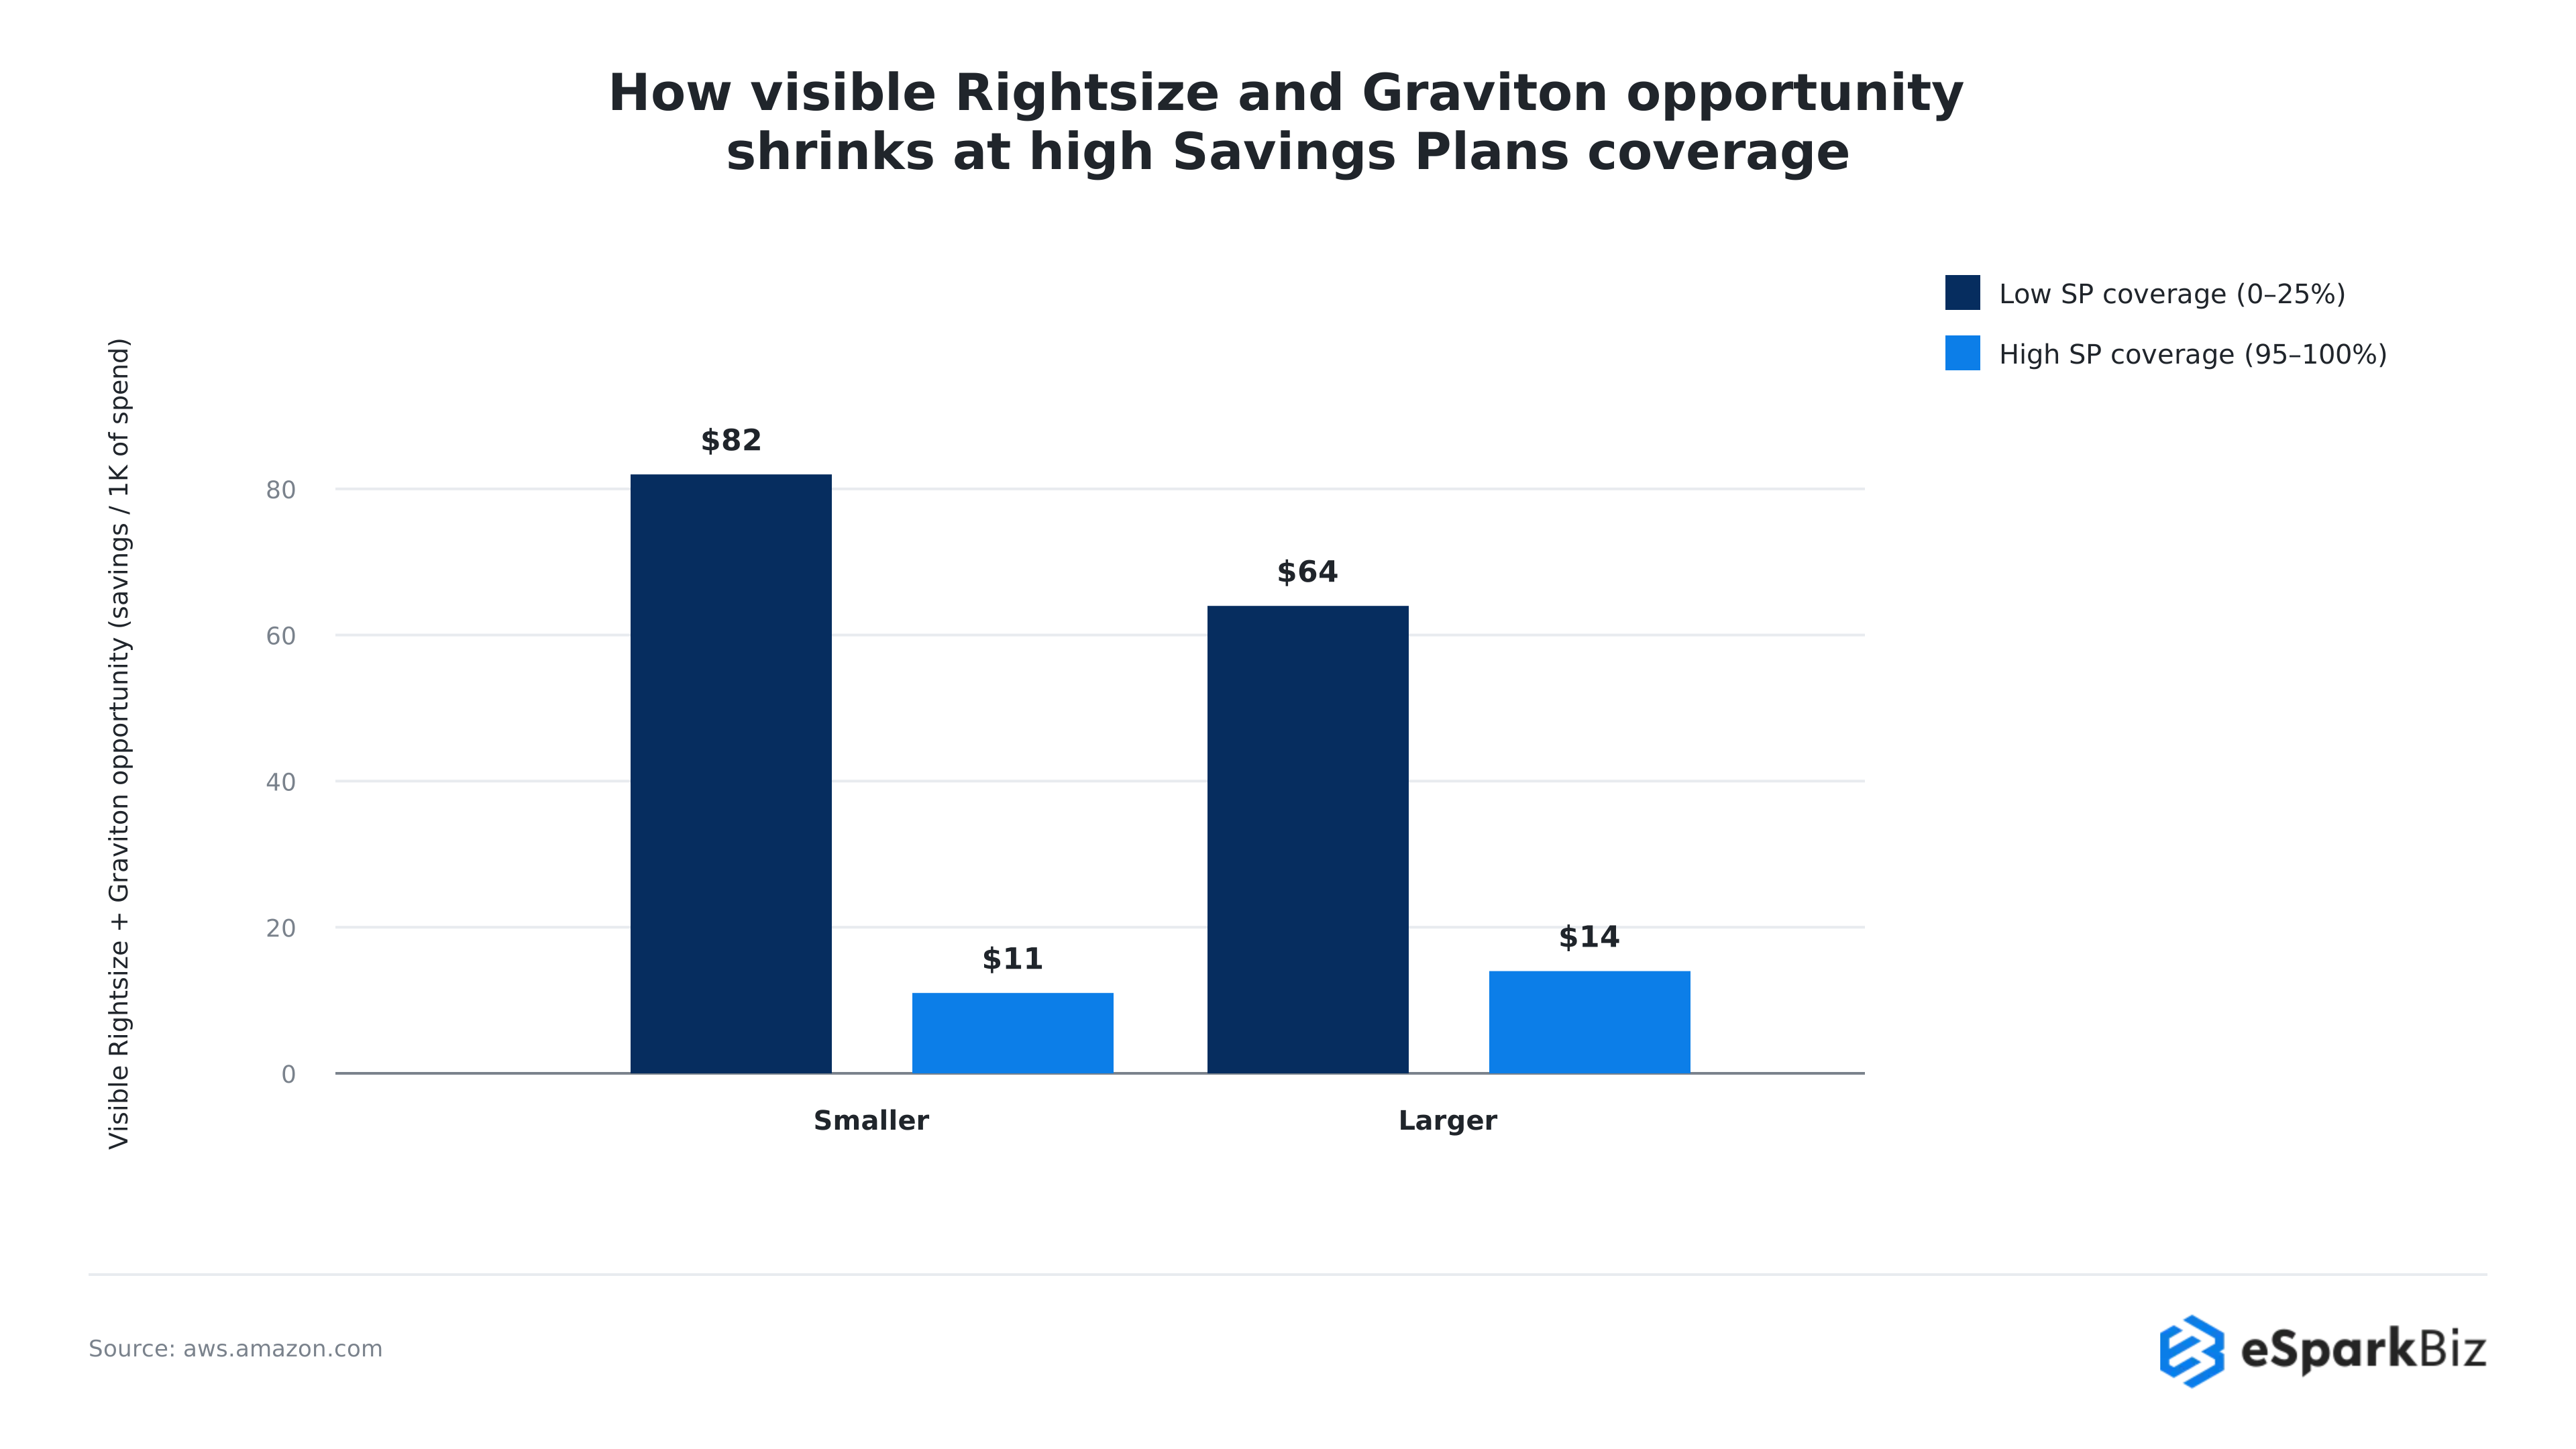
High Savings Plans coverage can mask large, idle resources. For coverage of 95-100% by High Savings Plans, the State of Cost Efficiency Report by AWS highlights that 65-80% of opportunities for optimization are removed.
Beyond the Dashboard: The Three Real Levers of Cloud Cost Optimization
There are three main factors that result in cloud cost optimization. Focusing on a single factor typically limits the overall potential cost savings. These factors are usage, architecture, and pricing.
Usage Efficiency
Usage optimization focuses on eliminating unused resources and adjusting resources to be more appropriate for the workload.
- Rightsizing: Align instance sizing to the reality of use rather than purchase extra capacity that is required only during occasional spikes.
- Idle resource cleanup: Remove any unused volumes, unused IP addresses, and any test environment that is still up and running but has no use anymore.
- Non-production scheduling: Turn off development and staging environment during non-working hours rather than keeping them always on.
- Storage lifecycle tiering: Transfer aged data that is rarely accessed to low-end storage rather than using only premium storage for all your needs.
Rightsizing reduces compute costs by 30-50%, and scheduled shutdowns reduce costs by 65-75% by eliminating spend on idle resources. More savings can be realized by examining resources that are overprovisioned.
Architecture and Service Choices
This lever focuses less on shutting resources down and more on making better technical choices when systems are designed and built:
- Managed vs. self-managed services: While a managed database may have higher hourly prices, it can minimize engineering efforts required to manage databases yourself.
- Cloud-native design vs. lift-and-shift: Direct migration of workloads from on-premises can overlook the scalability of clouds. Re-architecting them can allow costs to align with actual needs.
- Data transfer and Egress minimization: Data transfers between regions and services lead to unexpected costs, and are often not considered during cost reviews.
- Storage tier selection: Choose the right storage tier during system design instead of moving data to cheaper options later.
Tools like AWS Cost Explorer, Compute Optimizer and Trusted Advisor can help you find opportunities for cost savings. However, they do not help you decide which architectural change to make to resolve the issues they identify.
Pricing Models and Commitments
The pricing model determines the amount that you will pay for the cloud resources, whereas commitment reduces costs due to predictable usage.
| Model | Discount Range | Commitment | Best For | Risk |
| On-Demand | None | None | Unpredictable or dev/test workloads | Highest baseline cost |
| Reserved Instances | Up to -72% | 1-3 years | Stable and predictable workloads | Stranded spend if usage falls |
| Savings Plans | Up to -66% | 1-3 years, $/hr commitment | Variable but steady spend | Lower stranded-spend risk than RIs |
| Spot Instances | 80-90% | None (interruptible) | Fault-tolerant batch or ML training | Interruption risk |
The mistake most teams make here isn’t picking the wrong model. It’s committing before rightsizing. Locking in a discount against an oversized baseline just makes the waste cheaper, it doesn’t remove it.
Industry Reality
I don’t need a hard disk in my computer if I can get to the server faster… carrying around these non-connected computers is byzantine by comparison.
Where Cost Optimization Can Backfire
Being overly aggressive about saving money through cloud computing may lead to further issues. However, savings will be of benefit if they do not affect productivity and efficiency.
- Shutting down needed dev and test environments: Off hours shutdowns can save money, but they may slow developers when they need access outside normal working hours.
- Using spot instances for unsuitable workloads: Spot instances are a good option for certain batch jobs. However, for workloads that are not tolerant to interruptions, spot instances can cause significant issues.
- Automating changes without review: Automated rightsizing can reduce resources before a planned traffic increase if the tool does not have enough context.
- Treating cost control as an engineering only task: Finance and engineering need to work together. Without shared ownership, teams may avoid restrictions instead of addressing waste.
The goal isn’t simply to achieve the lowest cloud bill. It’s to reduce unnecessary spending while protecting reliability, delivery speed and team productivity.
Stop, Rightsize, Commit, Govern: Why Order Determines Whether You Save or Waste Money
Savings through cloud computing may depend on completing the required steps in the right order. Failing to do so will cut down your expected savings.
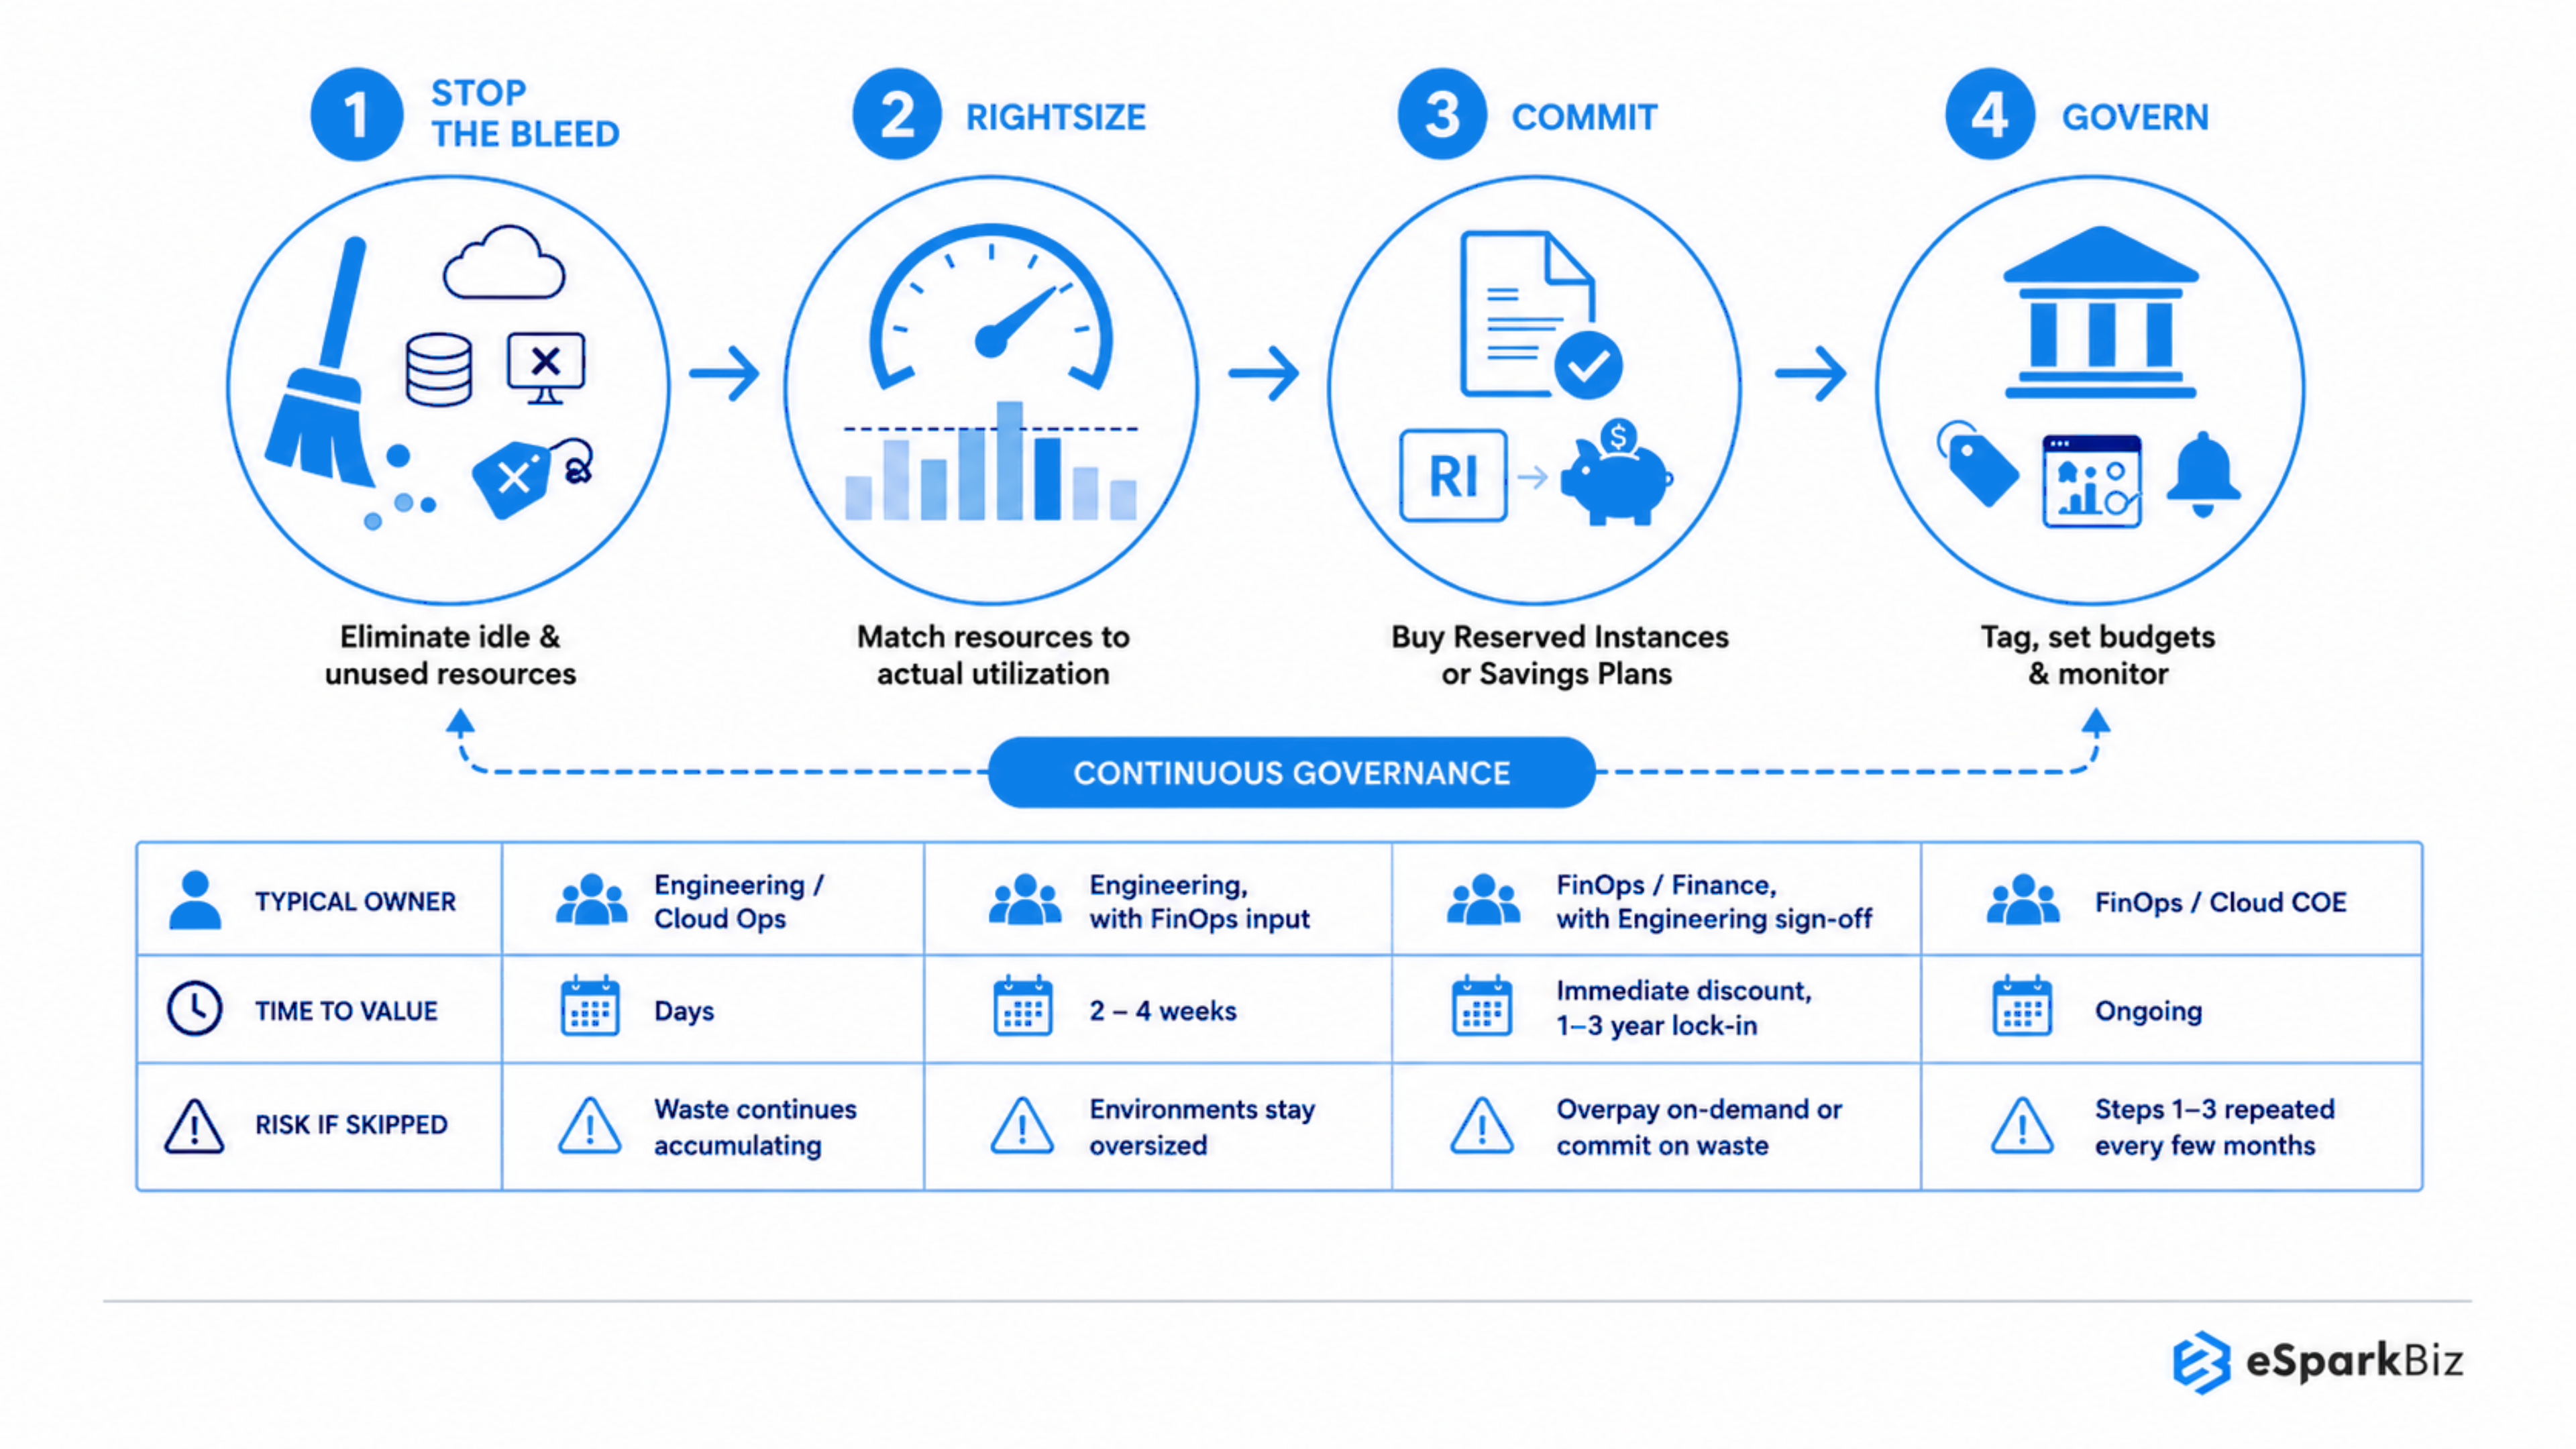
Many teams apply discounts before removing unused resources or fixing oversized systems. This may lower the bill without removing the actual waste. A better approach follows four simple steps:
- Stop the bleed: Remove idle and unused resources first, including unattached volumes, unused IPs and old test environments. This is quick to reverse and needs little analysis.
- Rightsize: Optimize resource sizes according to their actual utilization, with an ideal duration of 30 days instead of estimating in the beginning.
- Commit: After stabilization and right sizing of usage, one can move on to Reserved Instances and Savings Plans. This will help prevent commitments for unnecessary capacity.
- Govern: Implement tagging, budgeting, and alerts to monitor expenses and avoid the same wastage from occurring again.
Ownership & Equity by Stage:
| Stage | Typical Owner | Time to Value | Risk If Skipped |
| Stop the Bleed | Engineering / Cloud Ops | Days | Waste continues accumulating with zero effort to reverse it |
| Rightsize | Engineering, with FinOps input | 2 to 4 weeks | Environments stay oversized; future commitments lock in the wrong baseline |
| Commit | FinOps / Finance, with Engineering sign-off | Immediate discount, 1-3 year lock-in | Overpaying on-demand, or worse, committing against inflated usage |
| Govern | FinOps or a dedicated Cloud Center of Excellence | Ongoing | Steps 1-3 have to be repeated from scratch every few months |
Jumping right into step three is the biggest error made during cloud cost optimization. In addition to being the most costly, it requires the longest time to correct since it locks you into a commitment on an overspent infrastructure.
Why AI and ML Workloads Break Traditional Cloud Cost Rules
Traditional cloud budgeting assumes that the consumption pattern remains relatively stable. However, AI/ML loads may vary greatly, and, therefore, their expenses cannot be managed using traditional cloud budgeting.
Bursty Training Runs
A single training run can consume multiple GPUs for several hours and then suddenly stop. This can be quite strange to see in dashboards built for consistent loads.
Inference at Scale
The cost of inference increases as the number of users interacting with the model increases. This cost will vary greatly depending on the adoption rate of the product.
Experimentation Sprawl
Trying out various models and doing fine-tuning experiments may soon become expensive. And such costs tend to be dispersed among various resources.
Spot Instances for Interruptible Training
Training tasks which are capable of being paused and started later on may be well suited to using spot instances. Spot instance prices may cost 80-90% less than on-demand prices.
Right-Sizing GPU and Accelerator Families
It may be expensive to opt for the largest GPU always. Proper sizing of accelerators according to the model size, workloads, and batches helps in saving cost.
The Real Takeaway: There should be a special strategy for AI cost management. Specific monitoring, budgeting and accountability are required, as opposed to viewing AI workload management through a typical cloud perspective.
AI Acceleration
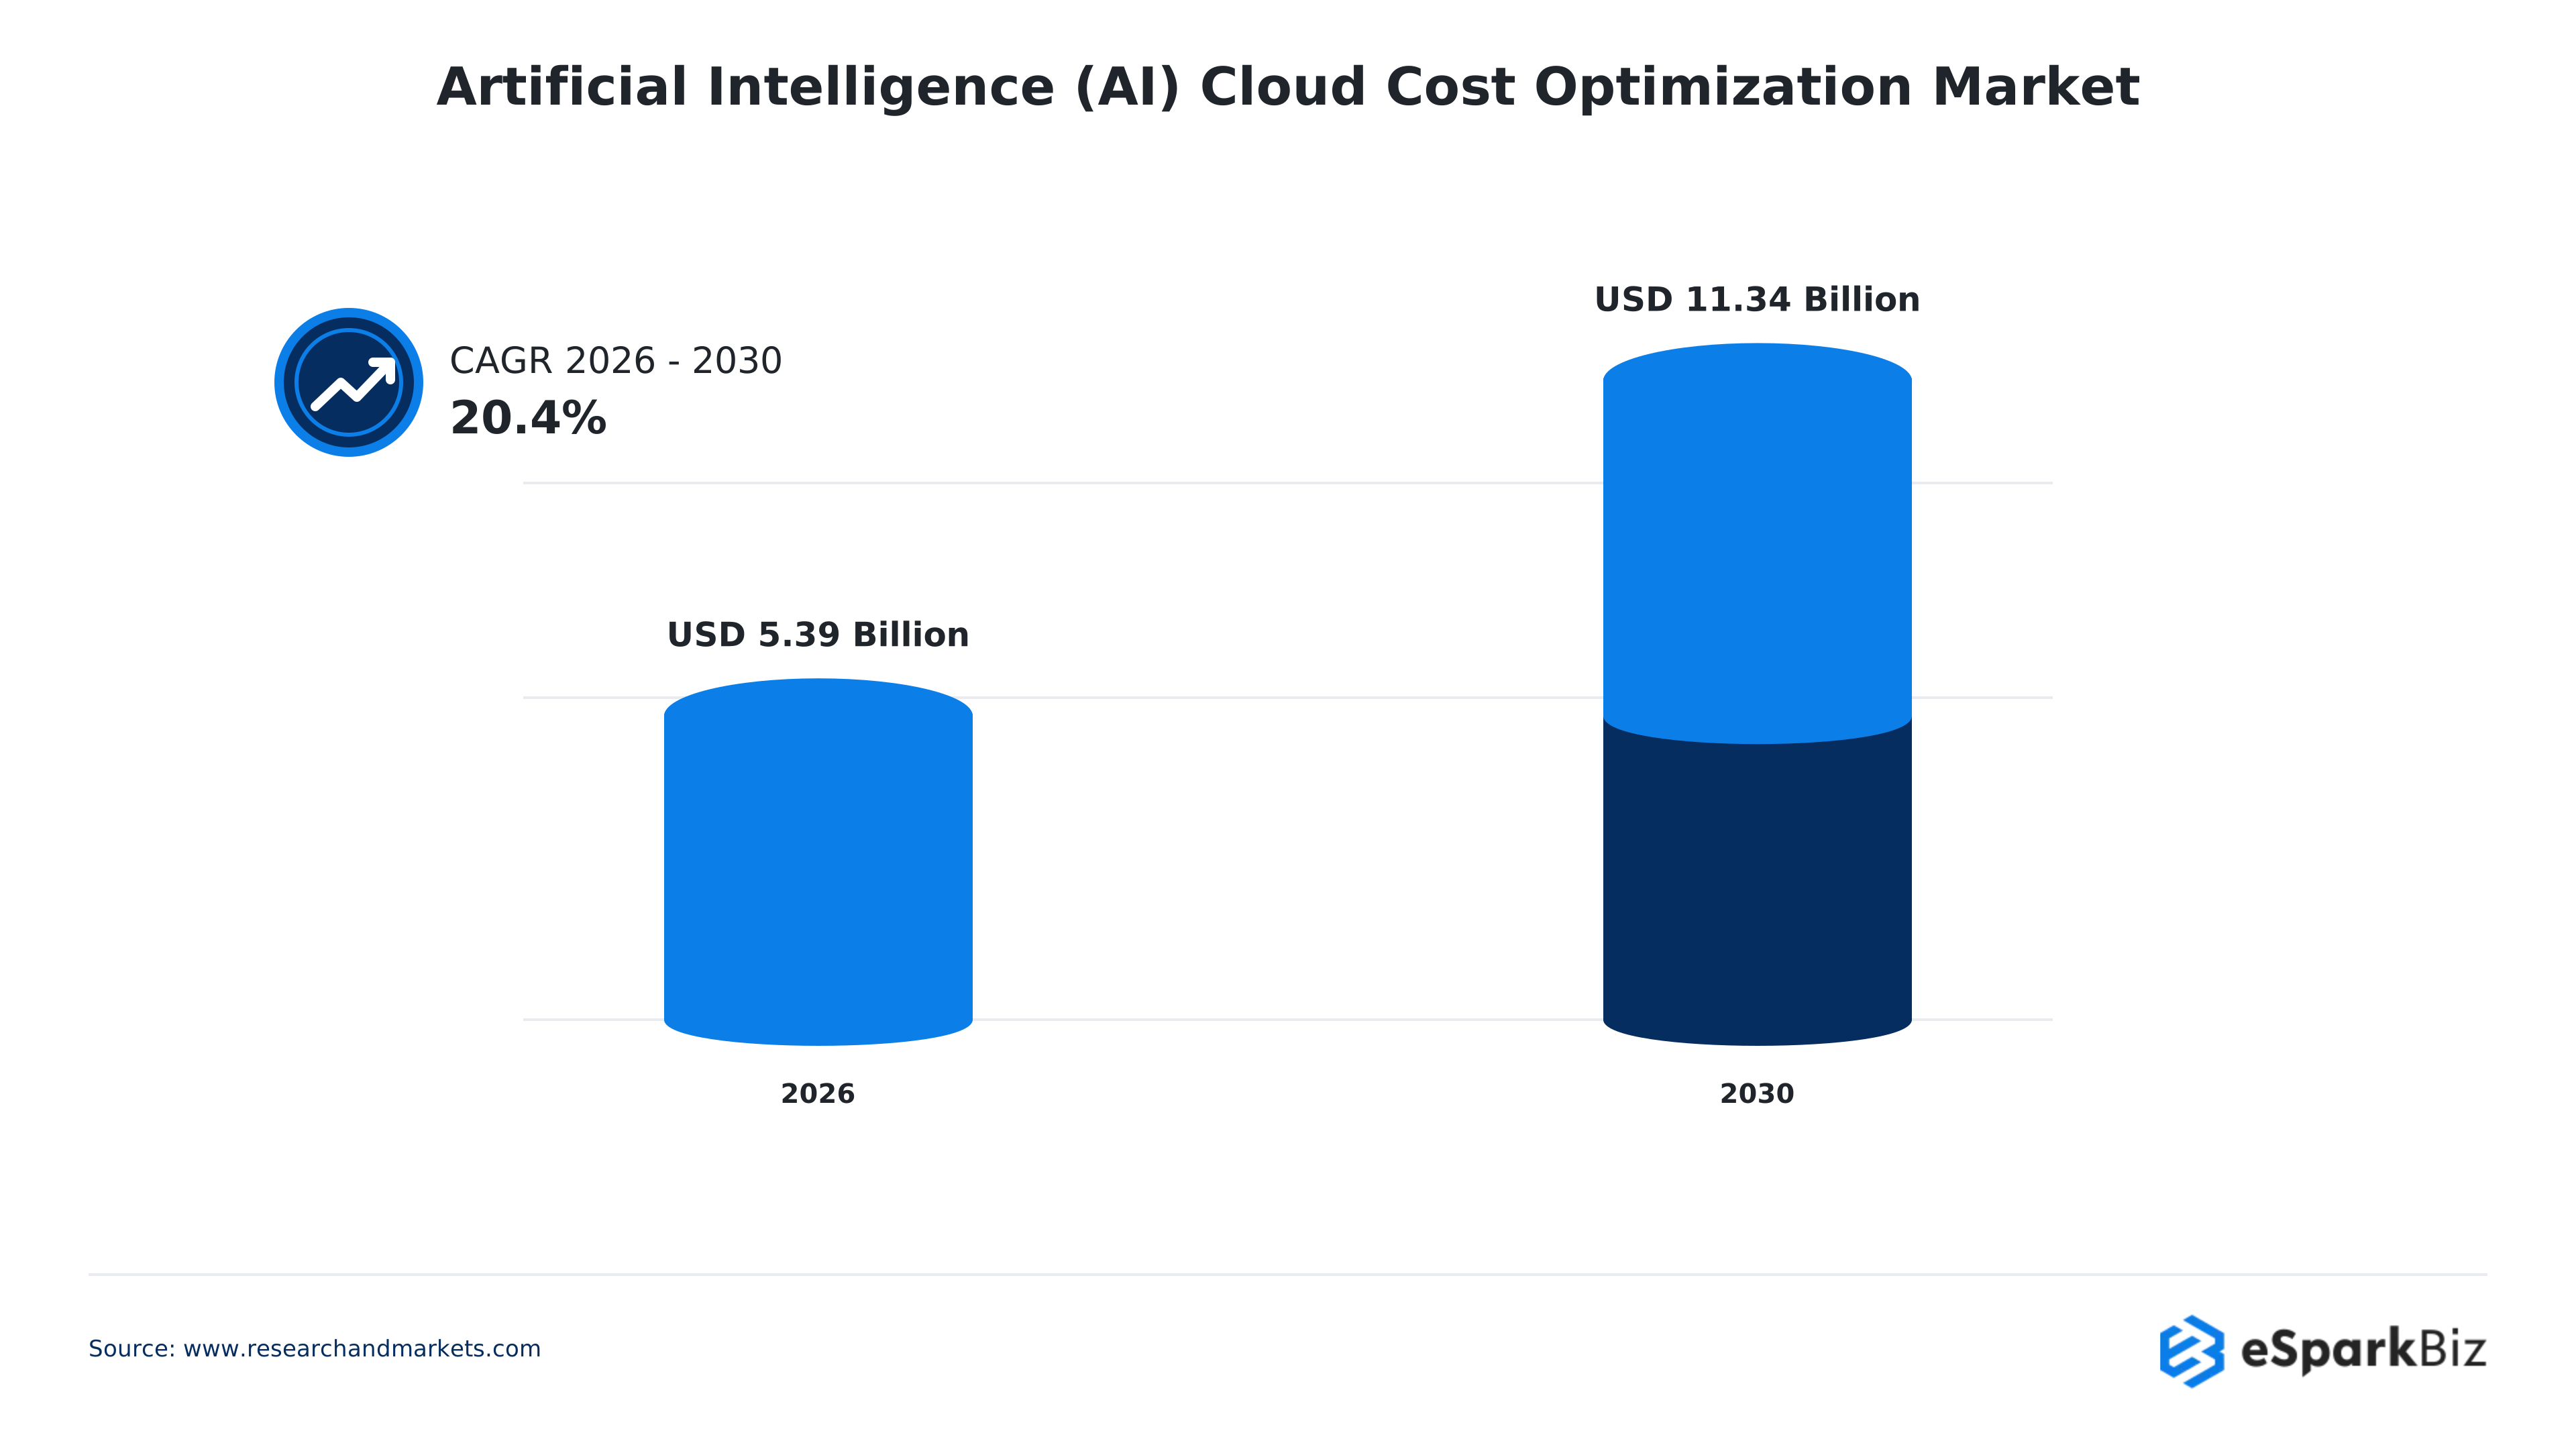
The AI cloud cost optimization market is projected to grow from $5.39 billion in 2026 to $11.34 billion by 2030, according to Research and Markets, nearly doubling as AI workloads continue to reshape enterprise cloud spending.
In-House vs. Partner: Who Should Own Cloud Cost Optimization
None of the options provided is universally applicable to all firms. The amount of time and engineering effort spent for cost optimization should be optimized.
Cloud cost optimization is not a one-time task. It requires continuous review and cleanup to make informed decisions. The important question is, who will be responsible for these tasks each month, once the initial work to achieve cost savings is completed?
| Criteria | Build In-House | Partner With a Cloud Engineering Team |
| Setup Speed | From weeks to months, after accounting for hiring and training | Few days to a few weeks, team already certified |
| Upfront Investment | Salaried employees with their benefits and training required | Engagement fees are typically offset by first pass savings. |
| Institutional Context | A complete understanding of your system and its history | Quick onboarding, but lacks in-depth internal knowledge at first |
| Scaling Flexibility | Fixed number of people irrespective of peaks in workloads | Scalable in size depending on what the engagement needs |
| Certification Depth | Entirely dependent upon whom you hire and keep | Verified AWS certified expertise from day one |
| Focus and Attention | Competes directly with the product roadmap for time | Cost savings is the only job, not just part of the job |
| Long-Term Ownership | Full control remains within your company | Governance can be transferred once everything becomes stable |
| Ideal For | Organizations with regular cloud spends and enough internal capacity | Companies looking for an initial pass at high speed and expertise |
When teams lack the required knowledge base, they engage certified AWS partners for the initial assessment before resuming control. However, there is no wrong choice, only poor time management.
Real-World Example
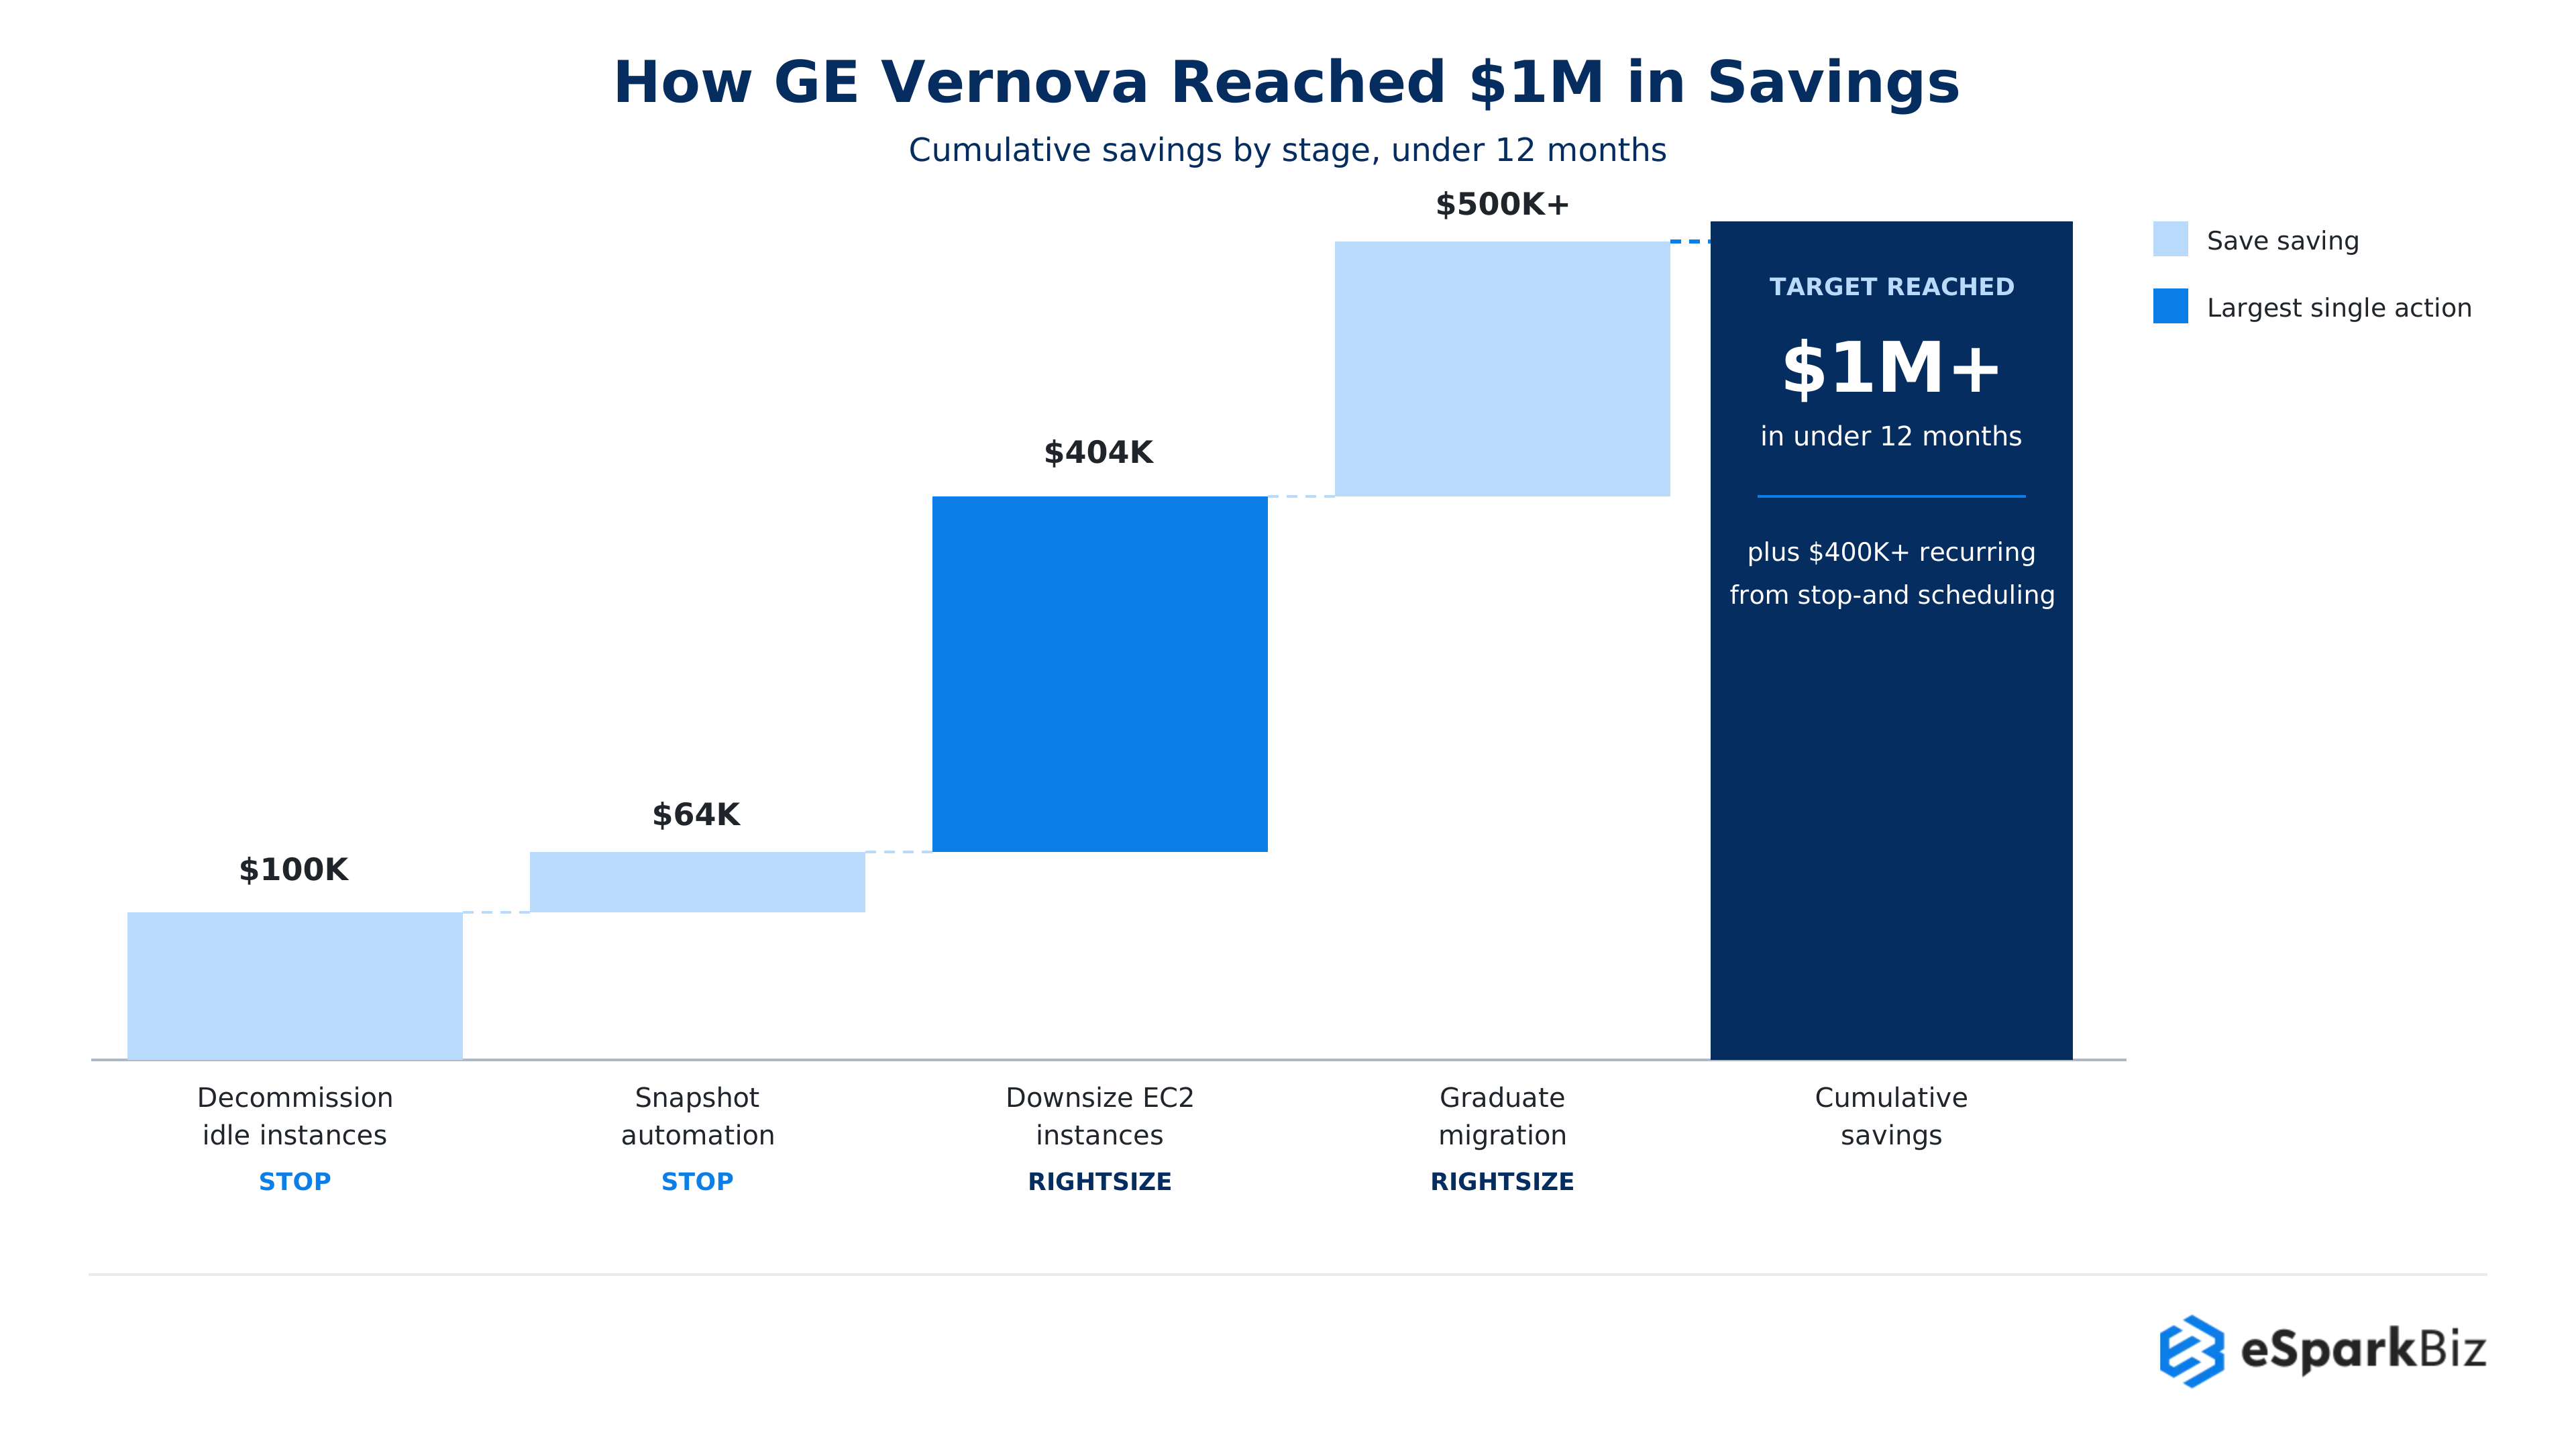
How GE Vernova Cut $1 Million in Cloud Costs in Under a Year
A real break down on where those savings actually came from, using the same four-stage sequence discussed above.
GE Vernova, a global energy company that is spinning off as an independent company, had to reduce cloud spending rapidly in its AWS environment. The outcome aligns perfectly with the sequence outlined above in this piece:
| Stage | Action Taken | Savings |
| Stop | Used AWS Trusted Advisor and CloudWatch to identify and shut down idle servers | $100,000 |
| Stop | Automated the manual snapshot creation process using AWS Lambda | $64,000 |
| Rightsize | Resized 50 instances to small instance types based on actual usage data | $504,000 |
| Rightsize | Migrated 128, followed by 246 more instances, to AWS Graviton processors | $600,000+ combined |
| Commit | Implemented automated scheduling to shut down 80% of non-production database instances | $460,000 per year |
| Govern | Active storage lifecycle management policies for migrating cold data to lower storage options | $18,000 per month |
The team met their goal of reaching one million dollars within a year, with an additional annual savings of $200,000 from Reserved Instances because they have done a proper rightsizing and sequencing of usage.
“Using AWS helps us put the entire business on a better path.”
Neil Leslie, Database Operations Leader, GE Vernova
Beyond the Bill: The Metrics That Prove Optimization Is Working
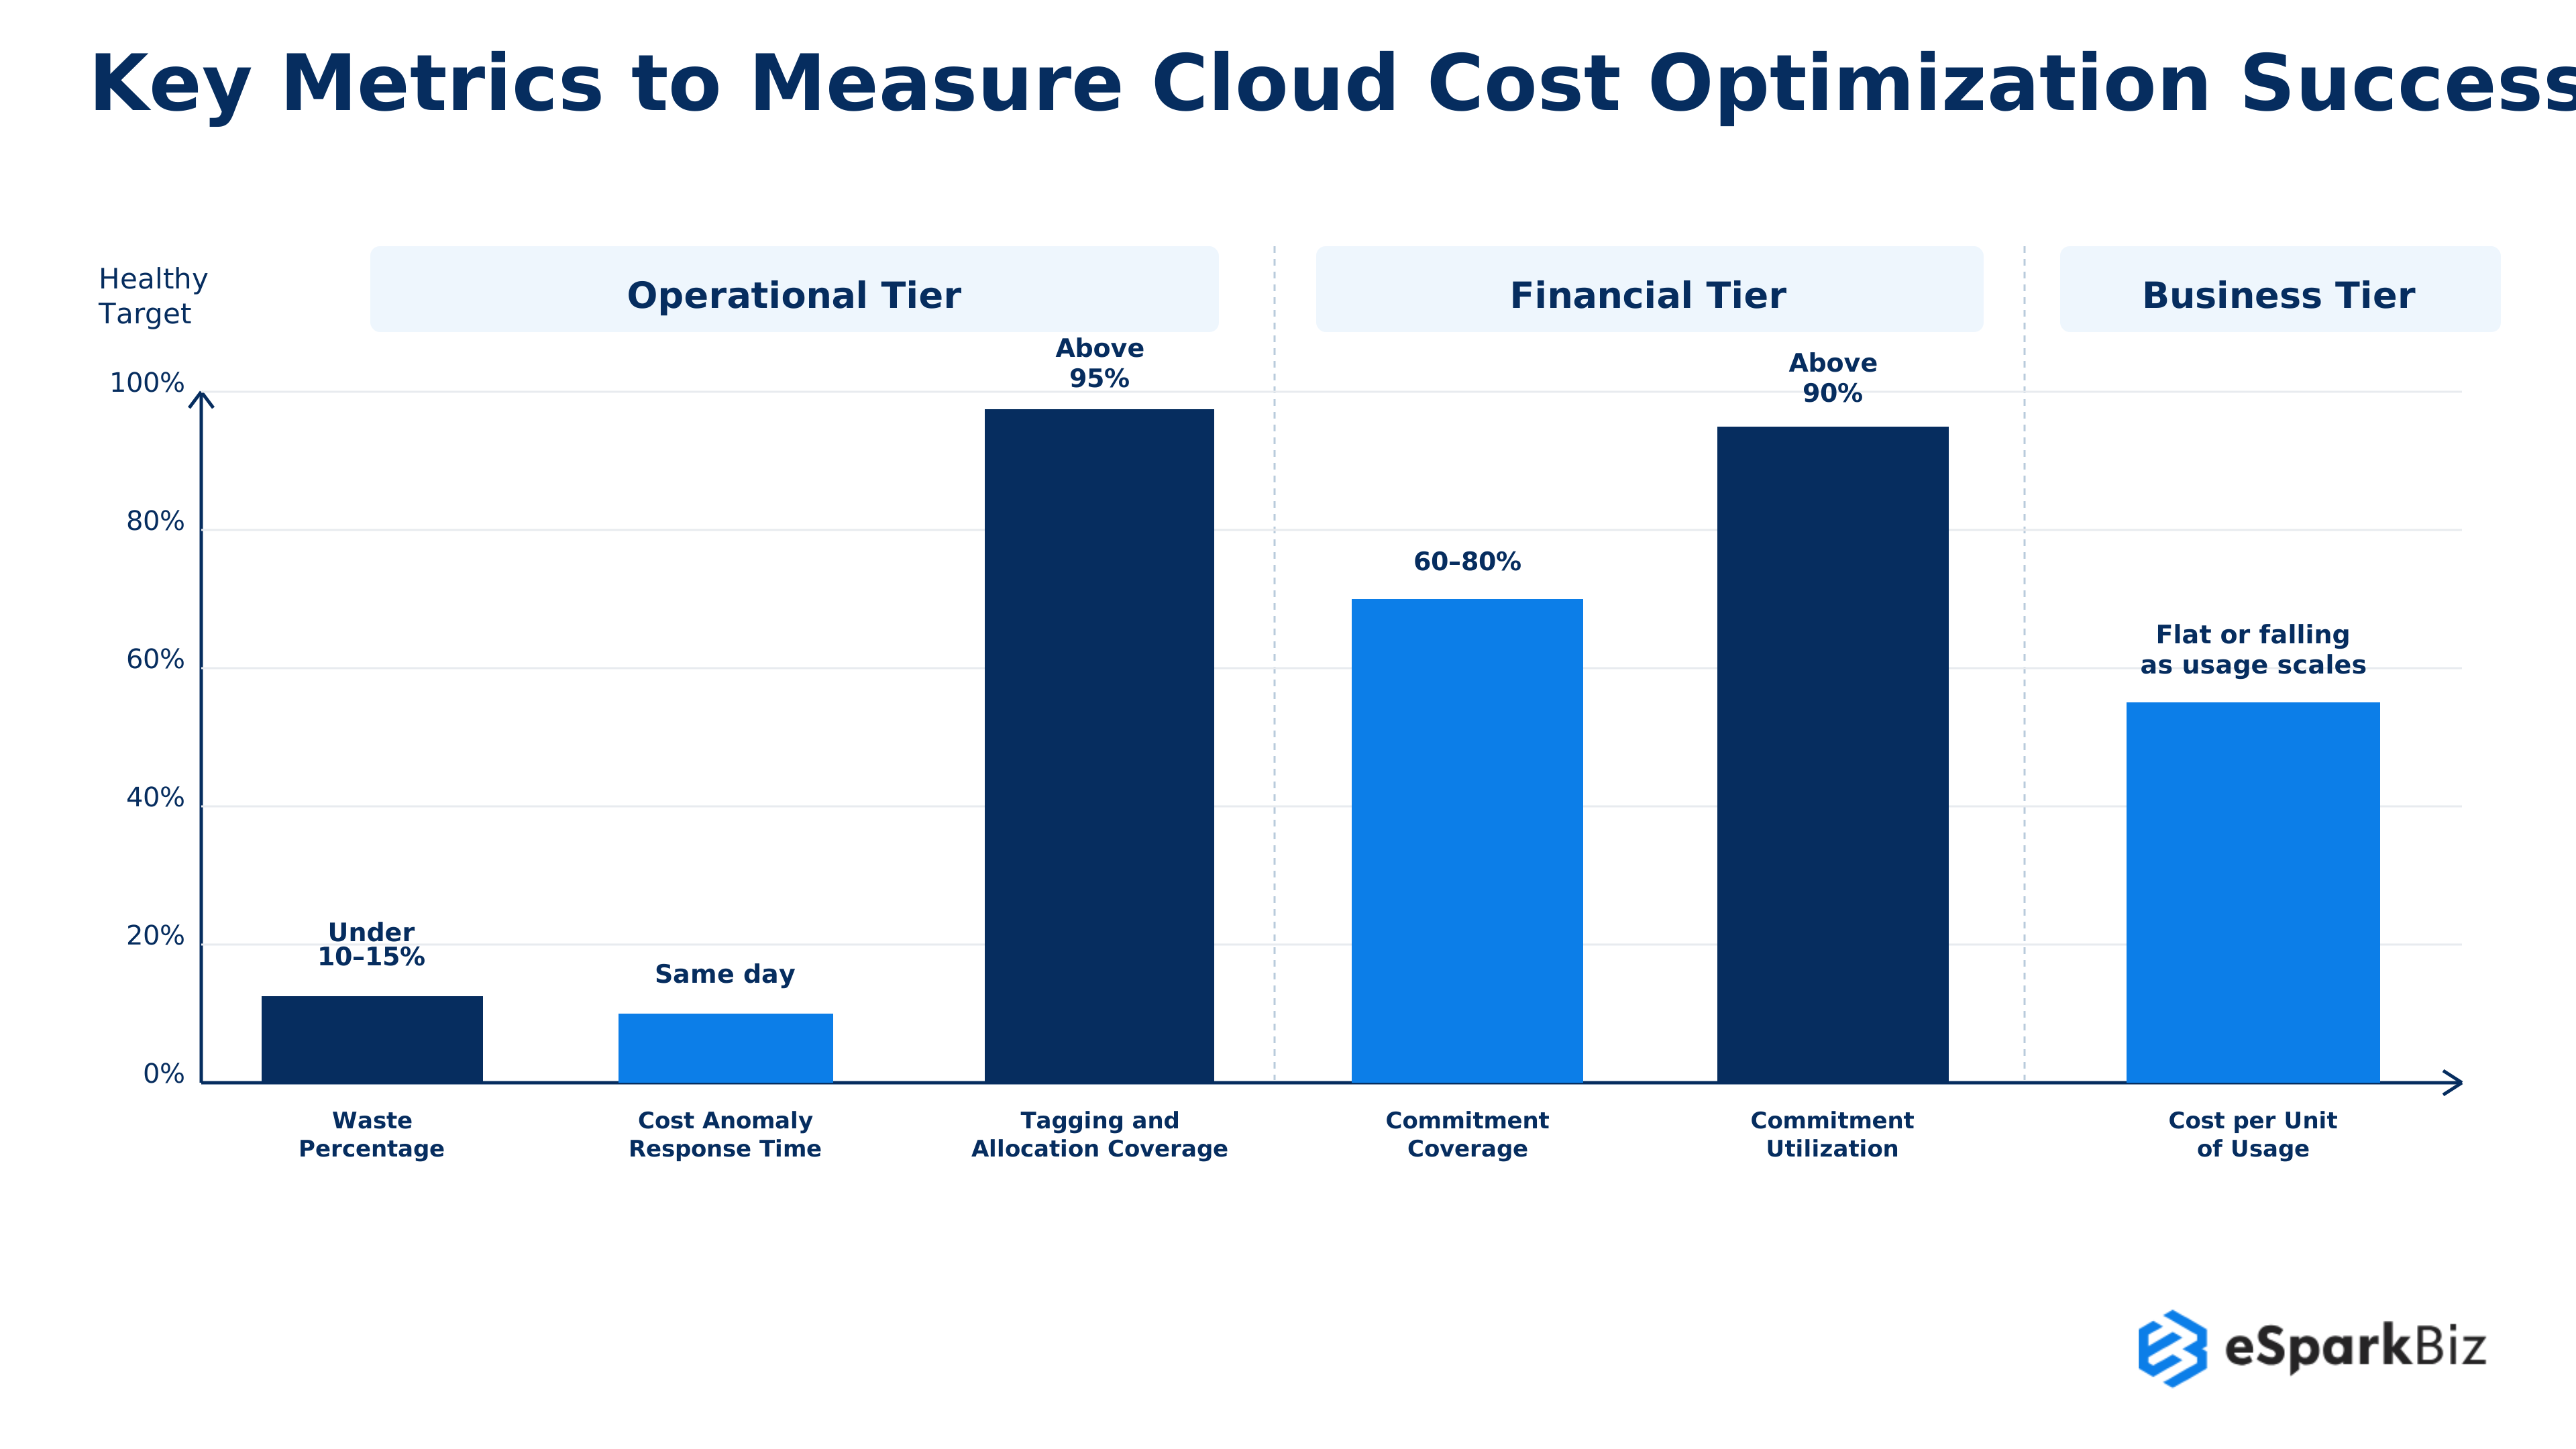
A decrease in your bill doesn’t mean you’ve saved money. These six metrics will show you if your provider is being effective.
A bill that falls one month and increases the following month doesn’t mean anything because total expenditure changes because of many factors that don’t have anything to do with optimizing.
KPI Table:
Operational tier (what engineering tracks weekly)
| Metric | What It Measures | Healthy Target |
| Waste Percentage | Amount of idle/oversized resources relative to spending | Under 10 to 15% |
| Cost Anomaly Response Time | How long it takes to recognize and investigate a spending increase | Sameday |
| Tagging and Allocation Coverage | Proportion of resources correctly identified | Above 95% |
Financial tier (what FinOps/finance tracks monthly)
| Metric | What It Measures | Healthy Target |
| Commitment Coverage | Proportion of regular spending covered by RIs/ Savings Plans | 60-80% |
| Commitment Utilization | Amount of spending commitment utilized | Above 90% |
Business tier (what the board sees quarterly)
| Metric | What It Measures | Healthy Target |
| Cost per Unit of Usage | Spend relative to a business metric, such as cost per transaction | Flat or falling as usage scales |
What the Board Actually Needs to See
Not six statistics every quarter, but one trend: is the cost per unit of usage increasing or decreasing as the company expands? This is the only level of reporting that is needed.
Where Does Your Organization Actually Stand
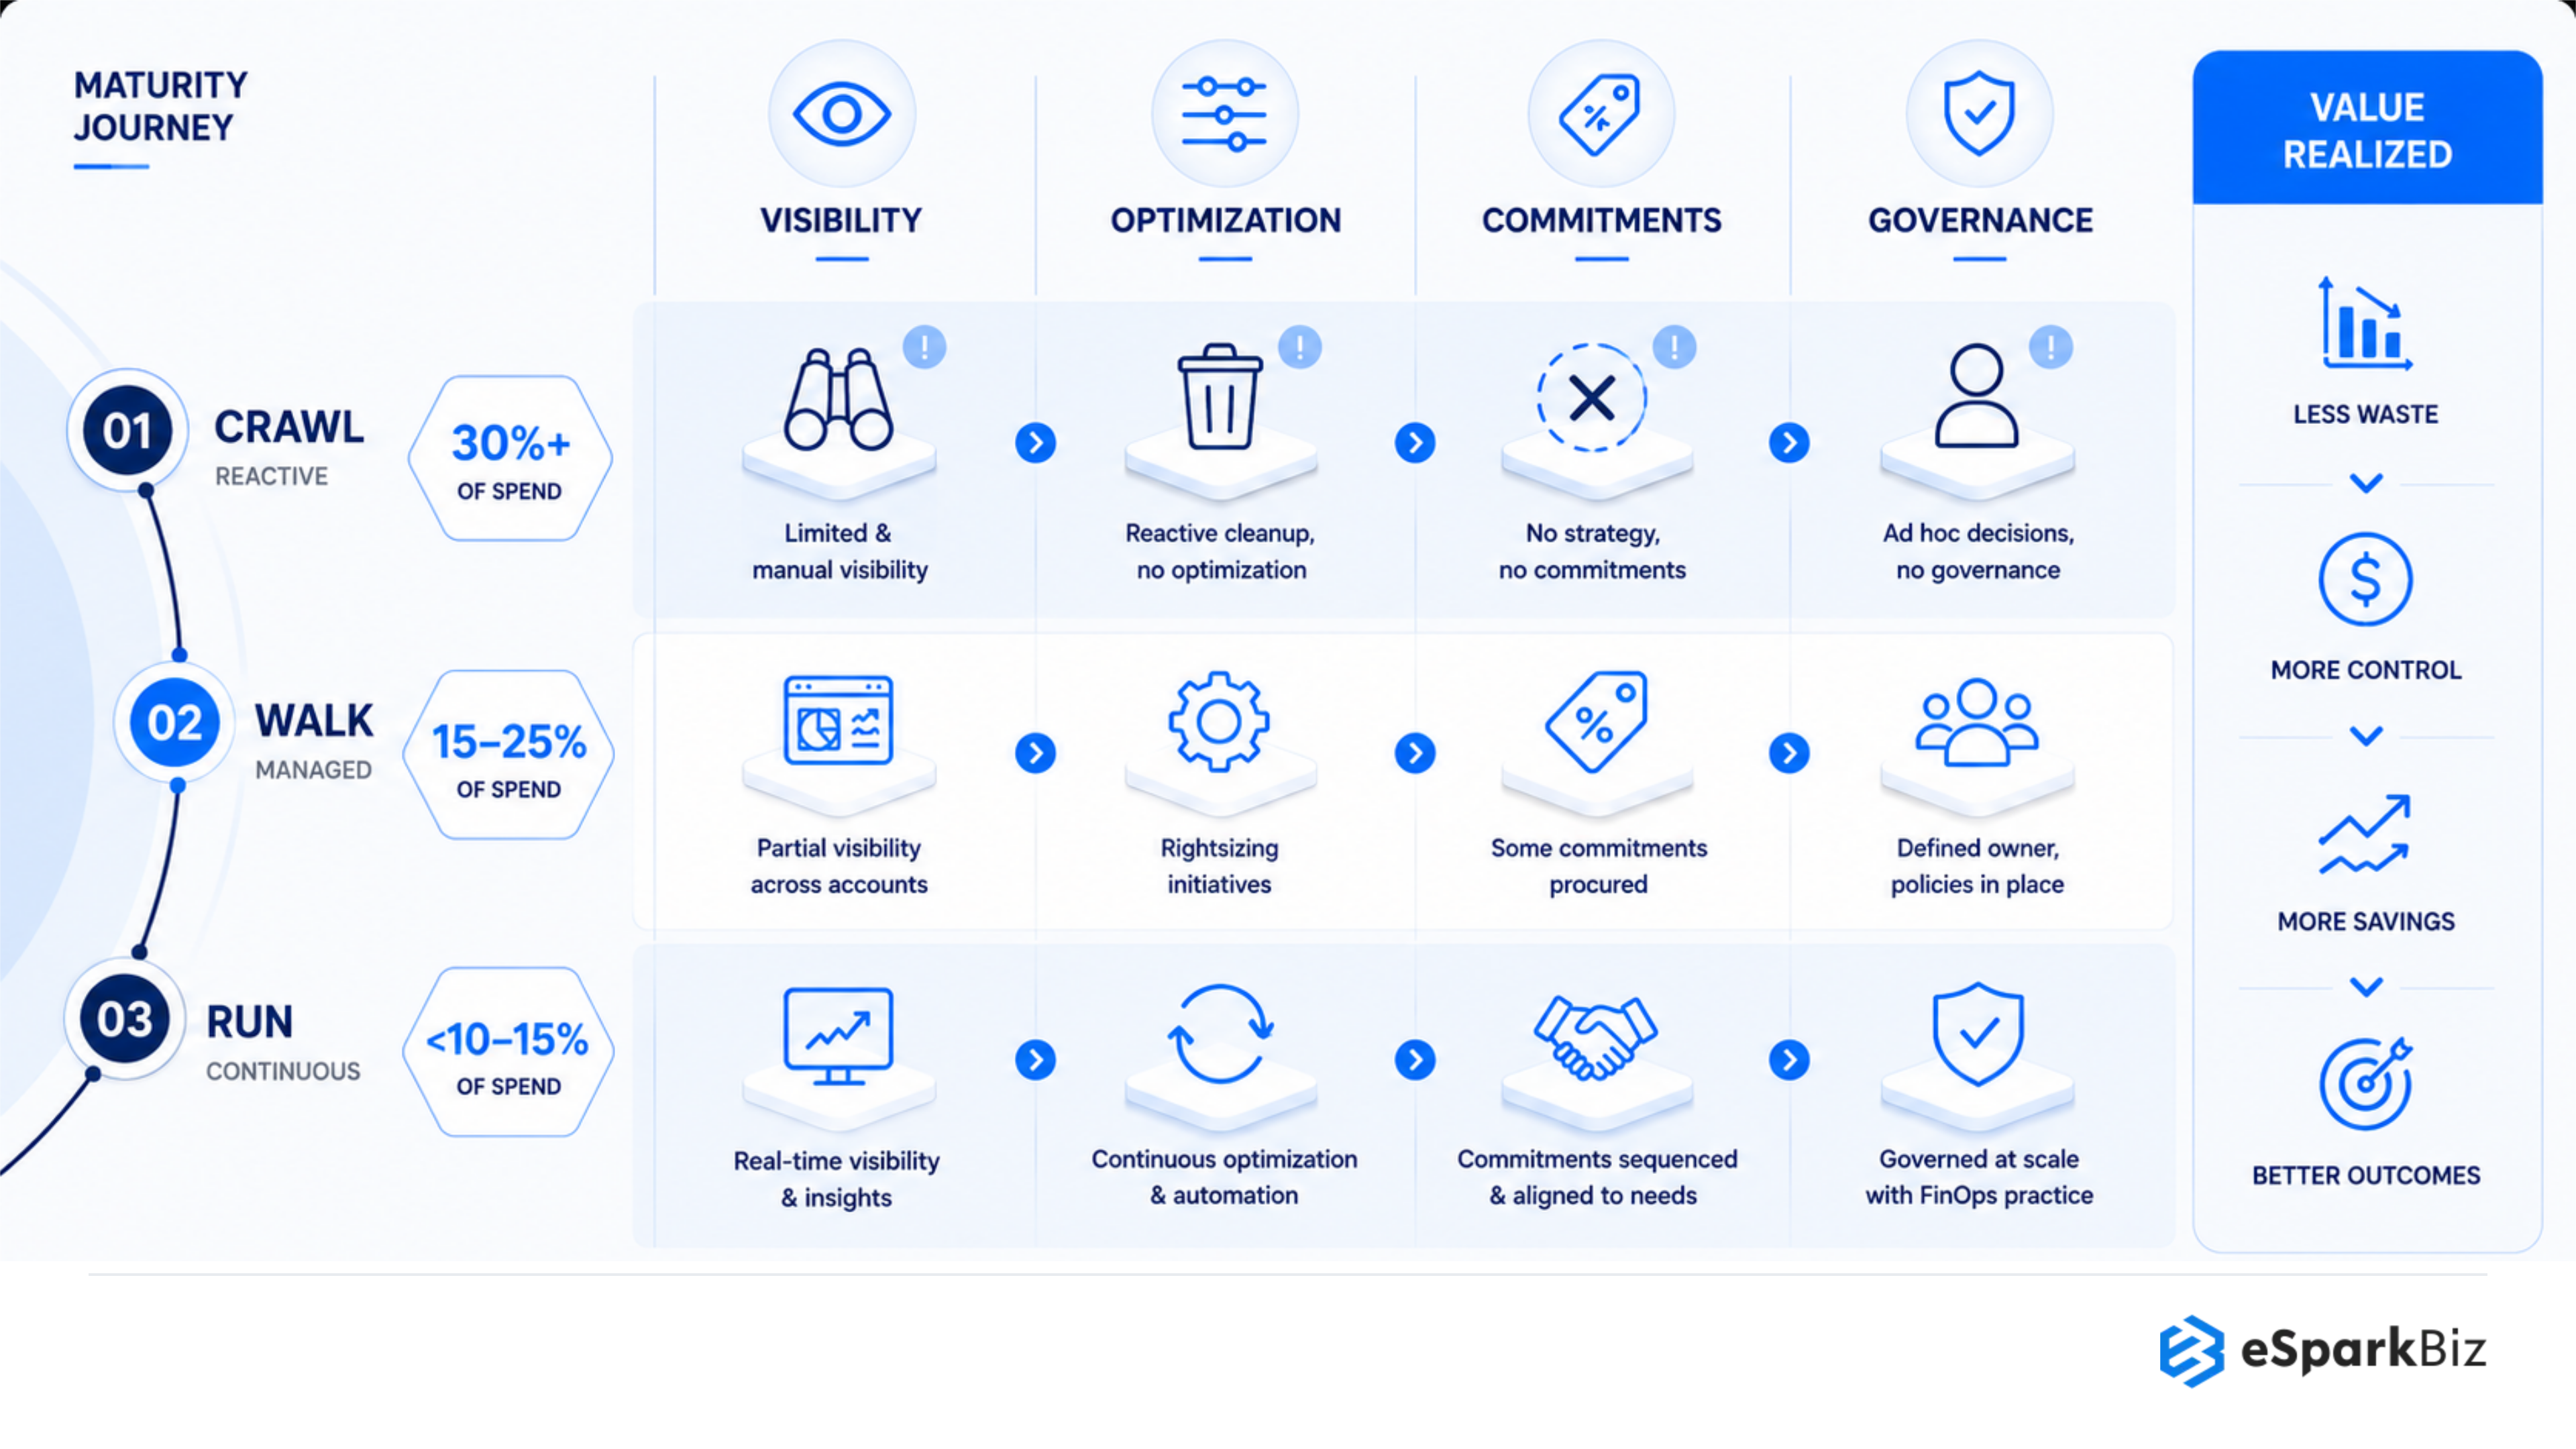
Most enterprises believe their cloud costs are under control, but hidden waste can tell a different story. Use this framework to understand where your organization stands today.
| Stage | What It Looks Like | Typical Waste Level | Who’s Driving It |
| Crawl | Basic visibility exists, but action is reactive and ad hoc | 30%+ of spend | One or two engineers, part time |
| Walk | Regular reviews, some rightsizing, commitments purchased inconsistently | 15 to 25% of spend | A defined FinOps or cost owner |
| Run | Continuous governance, commitments sequenced correctly, waste tracked as a KPI | Under 10-15% of spend | A cross-functional FinOps practice |
Most organizations we talk to place themselves at Walk. Most are actually at Crawl. The gap between where you think you are and where you actually are is usually where the first real savings live.
Frequently Asked Questions
Does cloud cost optimization happen before or after a cloud migration?
It is both. Prior to cloud migration, proper planning can prevent overprovisioning. After cloud migration, the process of optimization can correct the sizing and pricing mistakes made at migration.
What's the biggest mistake companies make in cloud cost optimization?
Purchasing reserved instances or savings plans without rightsizing first. By doing this, companies may save money but still be wasting resources.
How much can we realistically save through cloud cost optimization?
Organizations are able to cut their cloud expenditures by up to 20 to 40%, but this really depends on existing consumption, the size of resources, maturity of workloads, and current waste.
Is checking our cloud bill once a quarter enough?
Monthly checkups are a better place to start, together with constant alerts about unusual costs. Cloud usage can fluctuate quickly, and quarterly reviews may overlook it for months.
Does cloud cost optimization work with our existing FinOps or monitoring tools?
Yes. It can work with tools such as AWS Cost Explorer and FinOps platforms. These tools show spending and usage, while optimization adds the decisions needed to reduce waste.
How long does a cloud cost optimization engagement typically take?
Usually, an initial assessment and rightsizing will take around two to four weeks. Afterwards, reviews and governance will be performed to keep the savings as the workload changes.
What's the difference between Reserved Instances and Savings Plans?
Both offer real discounts, but they behave differently once usage patterns shift.
| Reserved Instances | Savings Plans | |
| Switching Flexibility | Locked to a specific instance family and region | Can shift across instance families and regions freely |
| Renewal Behavior | Requires manual repurchase at term end | Can auto renew based on committed spend |
| Typical Buyer | Teams with stable, long running workloads | Teams whose workloads shift but spend stays steady |
What tools are used for cloud cost optimization?
Most teams rely on a mix of native, third party and internal tools together.
- Native: AWS Cost Explorer, Azure Cost Management, GCP Billing
- Third party: FinOps platforms for cross cloud visibility and governance
- Internal: tagging policies, budget alerts and anomaly detection rules



 October 09, 2026