
- Outcome-driven KPIs & reviews
- US, UK & EU delivery experience
- High retention, stable teams
- Ongoing code reviews
- Fast onboarding (4-5 days)
- Pre-vetted senior developers
- Direct developer access
- Flexible engagement models
- Timezone-aligned collaboration
- Strong IP & data security


- 300+ Global Clients
- 4.9/5.0 Verified Clutch Rating
- 400+ Engineers & Specialists
- 95% Client Retention

About eSparkBiz
Why eSparkBiz for React Development Services?

Build Scalable React Applications with Proven Engineering Expertise
As digital products grow, frontend complexity can slow innovation and increase maintenance efforts. eSparkBiz combines AI-driven development workflows with advanced React engineering to build scalable, high-performing applications that deliver seamless user experiences and support continuous business evolution.
React ranks among the most admired Web Frameworks and Technologies, earning 52.1% developer admiration. Our React experts combine AI-assisted engineering, component-first architecture, and performance-focused development to accelerate delivery, simplify scalability, and future-proof modern web applications.
How eSparkBiz builds scalable React applications
- Improve Core Web Vitals for better search visibility
- Build reusable design systems for faster development
- Minimize UI regressions with reusable component libraries
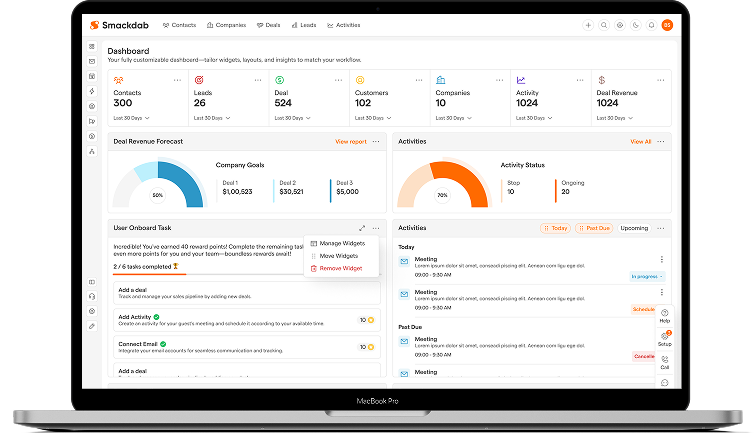
Success Stories

- Engagement Model Product Engineering Partnership
- Engagement length 48+ Months
- Market Stage Live & Scaling
- Team Member 20+ Team Members
- Services Provided End-to-End Product Engineering

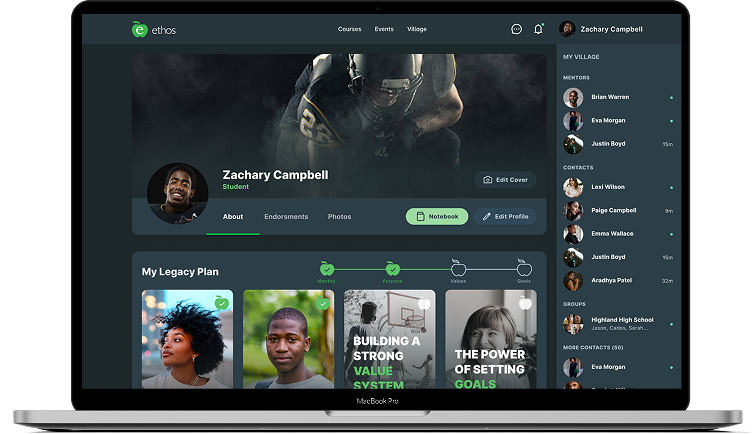
- Engagement Model Dedicated Product Team
- Engagement Length 24+ Months
- Market Stage Live & Scaling
- Team Members 5+ Team Members
- Services Provided End-to-End Product Engineering

- Engagement Model Dedicated Product Team
- Engagement Length Long-Term Engagement
- Market Stage Live & Scaling
- Team Member 6+ Team Members
- Services Provided End-to-End Product Engineering
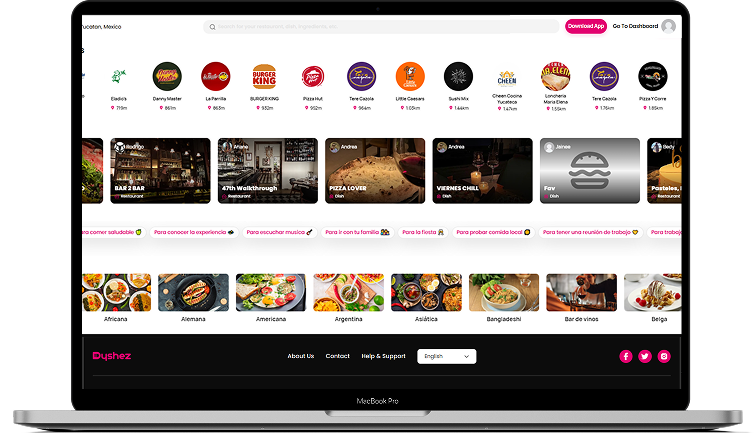

- Engagement Model Enterprise Engineering Partnership
- Engagement Length 24+ Months
- Market Stage Growth & Scaling Phase
- Team Member 4+ Team Members
- Services Provided PMS Integration & Hospitality API Integration Services
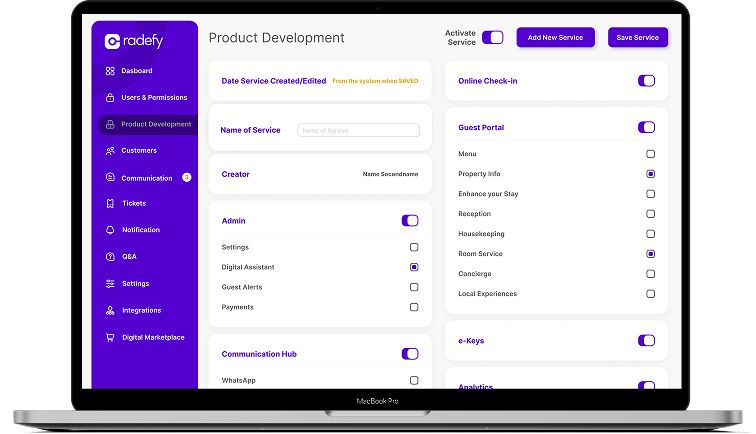

- Engagement Model Product Engineering Partnership
- Engagement Length 12+ Months
- Market Stage Live & Scaling
- Team Member 6+ Team Members
- Services Provided End-to-End Product Engineering
Proven work. Measurable outcomes.
See how we deliver on complex, high-impact Initiatives.End-to-end ReactJS Services
React JS Development Services We Offer
- ReactJS Consulting
- Custom UI/UX using React
- React AI/ML Automation Solutions
- ReactJS Version Upgrade
- ReactJS Plugin Development
- Custom ReactJS Development
- React PWA Development
- React Widget Development
- React Performance Optimization
- React Migration and Porting
- API Development and Integration

ReactJS Consulting Services
Our ReactJS consulting services help businesses address technical challenges and define clear development strategies. As a trusted React JS company, we analyze your requirements, existing systems, and goals to recommend practical solutions.
We focus on creating tailored strategies aligned with your business needs and market expectations. Our team uses modern practices and AI-assisted development to guide architecture decisions and optimize workflows.

Custom UI/UX using React
Partner with eSparkBiz as your React JS UI/UX Development needs that can help you develop applications with exciting UI/UX designs.
Our React Developers at eSparkBiz have experience in designing enterprise-grade applications for all devices like desktop, mobile or tablets, giving them a unique UI design and a great user experience.

React AI/ML Automation Solutions
We deliver intelligent React-based Artificial Intelligence, Machine Learning and automation solutions that help businesses streamline operations, enhance decision-making, and scale efficiently.
Our expert-driven approach ensures secure, high-performance applications powered by data-driven insights, seamless automation, and future-ready architectures tailored to enterprise needs.

ReactJS Version Upgrade
Our ReactJS version upgrade services ensure seamless migration to the latest stable releases with minimal risk and downtime.
We enhance performance, security, and compatibility while preserving application stability, enabling businesses to leverage modern features, improved scalability, and long-term maintainability.

ReactJS Plugin Development
Our ReactJS plugin development services help build interactive and robust web and mobile applications. We create custom plugins that extend application functionality, improve user interaction, and ensure seamless integration with your existing systems and workflows.
Our team develops scalable and efficient plugins using modern practices and AI-assisted development. These solutions enhance performance, support customization, and help deliver better user experiences aligned with your business and application requirements.

Custom ReactJS Development
As a leading ReactJS Development company, we have the ability to develop custom apps as per your requirements using the React UI framework.
The team of React JS Developers leverages the component-based architecture of React and builds scalable applications for all platforms.

React PWA Development
We are highly acclaimed in the business for developing robust and scalable Progressive Web Apps using the latest React features.
Our expert developers can craft scalable React web apps with near-native performance, offline capabilities and streamlined deployment. All this will be done through services workers and web app manifests.

React Widget Development
UI and UX are major components of the front end. We, as your ReactJS development partner, focus on designing more engaging and interactive user interfaces so as to give the best results to your customers on any device.
Hire remote ReactJS programmers proficient at developing appealing UIs with high-end solutions, as our core expertise lies in achieving interactive user interfaces with the help of powerful React libraries.

React Performance Optimization
With extensive experience building high-performance React apps, we can optimize for speed, memory and interaction response times as per your business needs.
React Performance Optimization Techniques like code-splitting, memorization, virtualization and animations ensure smooth user experience on diverse platforms and network conditions.

React Migration and Porting
If you already have an existing application and want to upgrade it or completely migrate your existing code based to React JS, we are here to help you.
Outsource React Development to eSparkBiz for seamlessly migrating your application to React JS with zero downtime and the highest possible security.

API Development and Integration
The team of React JS Developers here have expertise in developing custom API that includes integrating 3rd party apps on-premise or on the cloud.
With custom API development and React Integration Services, businesses can become more agile to handle more data within their existing application.
Leverage our Seamless React Development Approach for Dynamic Solutions
Why Partner
Why Partner with eSparkBiz?
Choose eSparkBiz as your Ideal React JS Development Partner providing dedicated development services to its clients. We have offices across the world and have successfully completed numerous projects.
-
CMMI Level 3 & ISO 9001 Certified for ReactJS Development Quality
-
Global React Delivery serving businesses in 10+ Time Zones Worldwide
-
Client-focused ReactJS Development aligned with Tailored Business Goals
-
Delivered Over 1000 Projects for Diverse Business Domain Needs
-
Recognized by Reputed Industry Evaluators
- Featured in IEEE list of Top Nearshore Software Development Firm
- Named among India’s Leading Enterprise Software Developers by Clutch
- Secures First Position in Cloudways’ List of Top Development Companies
- Earns #2 Spot as India’s Top 7 Product Development Firms -
Mastery in AI tools, Cloud, and Databases for future-ready ReactJS Development
 15+ Years of Expertise
  100% NDA-protected Contract
  95% Client Retention Rate
  Access to 45+ Technologies


Advanced Expertise
- Custom React JS App Development
- React JS Interactive UI Development
- React JS Front-End Web Development
- React JS API Integration
- React JS Enterprise App Development
- ReactJS Dashboard Development
- React JS eCommerce Development
- React JS Migration Service
- React JS Support and Maintenance
- ReactJS Product Development
- Reactjs Development Environment
- ReactJS Customization Services
- ReactJS Upgradation
- React Storefront Development
- ReactJS Portal Development
Reactjs Tech Combinations
Robust Tech Combination for React Full Stack Development
At eSparkBiz, as a leading ReactJS development Agency, our team implements the use of the following ReactJS Technology Combinations in the development of effective full-stack React applications.


React + MERN Stack
Using the combination of React with the MERN stack, our developers design full-stack JS applications for engaging and scalable apps that boast smooth front-end and back-end integration.

ReactJS with Python
When integrating React with Python backends such as Flask or Django, our developers provide our clients with clean, efficient, and effective applications.

ReactJS with Django
Using React with Django enable the development of highly secure and scalable applications with a strong back-end foundation suitable for enterprise applications.

ReactJS with Flask
With React and Flask, you get fast and lightweight applications that are also very scalable, which is good for short projects.

ReactJS with Golang
With React and Golang, our team is capable of crafting fast and concurrent web applications that are well-suited to multitasking.

ReactJS with Express
ReactJS and Express together can develop efficient and versatile applications. This combination fosters an easy API link and accelerates development timelines leading to proficient workflows.

ReactJS with Gatsby
We create fast and static websites with the help of Gatsby and React and deliver services that meet your business requirements.
ReactJS with React Native
Combining ReactJS with React Native helps in enhancing the application development suitable for both iOS and Android.

React + Firebase
The developers in our team employ Firebase with React to create applications that have real-time capabilities, secure authentication, cloud storage, and efficient database management suitable for rapidly scaling projects.


React + .NET Core + Microsoft SQL Server
We provide enterprise-level web application development using React with .NET Core and SQL Server to deliver secure, maintainable, and high-performance solutions aligned with your business objectives.

React + GraphQL
We use React and GraphQL to design effective and scalable APIs that can quickly retrieve data and enhance the performance of large-scale applications.

ReactJS with Java
Java when combined with React enables developers to build applications with a robust back-end and scalable, flexible architecture.

ReactJS with Next.js
The integration of React with Next.js allows for the development of applications that are capable of rendering on the server-side and therefore need not take an elongated time to load.

ReactJS with Material UI
When using Material UI together with React, our developers create attractive and intuitive interface elements that complement your application.

ReactJS with Redux
Our developers incorporate Redux to help them handle state management in applications built with React especially those with large sizes.

ReactJS with Docker
We employ Docker to encapsulate React applications thus making them portable, scalable, and manageable in any environment they are to be deployed.
Accelerate your Roadmap with Trusted React Development Company
Competencies

NextJS
NextJs gives us the ability to do server-side rendering to achieve the fastest, SEO-friendly websites and applications possible with intuitive navigation, perfect for both static and dynamic applications.
Gatsby
Our developers leverage Gatsby for the creation of high-loading and easily scalable static websites that are ideal for content-intensive websites such as blogs or eCommerce.

Material-UI (MUI)
We use React with Material-UI to develop attractive, responsive applications with pre-built components that help reduce the development time and increase the design coherence.

React Native
Thanks to our experience in React Native, we can provide our clients with high-quality cross-platform applications with React and React Native that have a native look, feel and performance.
Create React App
Create React App helps create efficient, reliable, and scalable React applications from scratch in a short time, which can be helpful for businesses to create and deploy their apps.

Tailwind CSS
Our developers use Tailwind CSS to style React apps to make the process fast and to have an adaptable and flexible system that will improve the look of the UI.

Storybook
We use Storybook to create and preview UI elements outside the application, thus improving the overall quality and speeding up the development process.
Redux
Redux helps us deal with the state of React applications. It enables developers with effective React state management of the whole application in a predictable, scalable way that is easy to understand.

Just for Unit Testing
Using Jest, we can test all our React applications at the unit level to catch any bug that could be hiding and to increase the stability of the code by using high-quality test coverage.

Cypress for End-to-End Testing
Our dedicated development team utilizes Cypress to perform end-to-end testing and guarantee that all the interface and backend elements of the applications are integrated correctly.

Internationalization
Internationalization is used to launch React applications that are easily scalable to other countries providing multilingual support to users.

Chart.js for reporting
With the inclusion of Chart.js, we make animated and engaging diagrams and graphs that improve reporting aspects in React applications and can be easily used to help in decision-making in businesses.
Turn Your Vision into Futuristic Reality with Our Advanced Angular Expertise
Process
Engineering Delivery Framework
Align technology with your business goals.
Every engagement starts with understanding your business objectives, users, technical challenges, and product vision. Together, we define a roadmap that minimizes uncertainty and creates a clear path to successful delivery.- Business Requirement Document
- Technical Feasibility Report
- Stakeholder Alignment Map
- Project Roadmap with Milestones
- Competitive Landscape Summary
Create intuitive experiences and scalable architecture.
Our designers and solution architects collaborate to create user-centric experiences and a technical foundation that supports long-term growth, security, and maintainability.- Functional Requirement Document
- Clickable Figma Prototype
- Solution Architecture Diagram
- Database Schema
- API Specification Sheet
Deliver software through agile engineering.
Dedicated cross-functional teams develop your product in short, iterative sprints, enabling continuous feedback, rapid releases, and complete project transparency throughout the development lifecycle.- Working Sprint Builds
- API Integration Map
- Version Controlled Code Repository
- Sprint Burndown Reports
- Technical Documentation Wiki
Build quality into every release.
Quality engineering is integrated throughout development, not left until the end. Automated testing, peer reviews, and security validation ensure reliable, production-ready software at every milestone.- Test Case Documentation
- Automated Test Coverage Report
- Security Vulnerability Assessment
- Performance & Load Test Results
- UAT Sign-off Checklist
Release with confidence.
We automate deployment pipelines and implement modern DevOps practices to deliver secure, reliable, and seamless releases while minimizing operational risk and downtime.- CI/CD Pipeline Configuration
- Production Deployment Runbook
- Infrastructure-as-Code Scripts
- Rollback & Disaster Recovery Plan
- Go-Live Readiness Checklist
Continuously improve and evolve your product.
Launching software is only the beginning. We continue to optimize performance, introduce new capabilities, strengthen security, and scale your engineering capacity as your business grows.- Performance Benchmark Report
- Cloud Cost Optimization Summary
- Quarterly Enhancements Roadmap
- Security & Compliance Audit Log
- Engineering Capacity Scaling Plan
Ready to Streamline your ReactJS Development?
Industries
Proven Expertise across Diverse Industries
We deliver tailored technology solutions across various business domains, addressing unique operational challenges while driving measurable business growth consistently.
Healthcare
Finance
EdTech
Real Estate
Logistics
Food & Beverages
AgriTech
Sports
Engagement Models for Enterprise Software Delivery
IT Staff Augmentation
Dedicated Teams
Offshore Development Center

Fill specific skill gaps fast with vetted, senior engineers who plug directly into your existing team and processes. You keep full control of project management and architecture decisions while we handle sourcing, vetting, and onboarding speed.
- Quickly scale your team up or down based on project needs
- Works inside your existing tools, tickets, and sprints
- Fast onboarding with minimal management overhead
- Minimal management overhead, maximum flexibility

Get a committed, cross-functional team that works exclusively on your product, functioning as a seamless extension of your organization. We assemble the right mix of engineers, QA, and leads, aligned to your roadmap for the long haul
- Full ownership of onboarding, knowledge transfer, and documentation
- Consistent project execution with strong budget and risk management
- End-to-end coverage: business analysis, UX/design, QA, DevOps, and project management
- Best for long-term product development

Establish a fully dedicated offshore unit that operates as your own remote engineering office, complete with infrastructure, HR, and compliance handled on your behalf. Built for long-term scale with maximum cost efficiency and control.
- A 100% personalized solution for large, complex projects
- Built for corporate clients with specialized requirements
- Meets high standards for security, availability, and compliance
- Dedicated, fully managed offshore team aligned to your business
Our Clients
Our Clients Say About Us
We focus on making clients happy and always appreciate their opinions. We aim to provide superior services to earn trust and to become a go-to choice in the industry.


Useful Resources
Useful Resources for ReactJS Development
We deliver curated expert knowledge-driven content, offering strategic depth, industry relevance, and actionable insights for confident technology decisions.

Angular Development
Build Scalable Interfaces with Angular Development Expertise

VueJS Development
Create Interactive Interfaces powered by VueJS Innovation

NextJS Development
Deliver Exceptional Digital Experiences through NextJS Engineering

Hire React Node Developers
Hire React Node Experts delivering Unified Engineering Excellence

ReactJS Consulting
Accelerate Frontend Success With Expert ReactJS Advisory

Hire React Storefront Developer
Create High-converting Storefronts with React Storefront Specialists
Expert Insights
Expert Insights for ReactJS Development
We actively analyze emerging technologies and applications, publishing insightful articles. Access our latest expert blogs and updates for valuable industry knowledge.


FAQs
Frequently Asked Questions
Transform your Business excellence with the Ideal ReactJS Development Company to achieve interactive User Interfaces. Understand the Common Questions, businesses always have in their mind when consulting us as their React Development Partner.
What are React JS development services?
React JS development services focus on building modern user interfaces using React. They include custom web application development, single-page applications, UI modernization, API integration, and performance optimization.
How much does it cost to build React apps?
The total cost of developing a React app varies depending on factors such as the functions you want to add, the type and number of resources you need, the React project size, and your selected engagement model . Hence, the more complex and demanding the project management and its features are, the more time and money it will require to be invested in.
If you want to outsource your React projects, eSparkBiz is your most dependable Reactjs web development company in India and the USA, where you do not have to worry about the limited budget of your projects. Our geographical location allows us to offer cost-effective React JS Development services and resources for your custom business requirements. The hourly rate for hiring ReactJS Developers with us ranges from $12/hr to $18/hr, reducing your app development costs by nearly 40%.
What kind of applications can you build using our Reactjs Development Services?
React is a powerful front-end framework that allows you to build various modern applications. As an experienced React development agency, we can build a vast range of business-specific ReactJS Development services & solutions, like
- Customized, real-time Apps
- Interactive front-ends
- Social Media Apps
- PWAs and SPAs
- eCommerce Apps
- Streaming and Entertainment Apps
- Messaging Apps
- Tracking Apps
How is eSparkBiz the leading Reactjs development company?
Be it outsourcing your complete React development project, hiring skilled Reactjs developers, or building a dedicated development team to handle complex tasks, eSparkBiz is your one-stop shop for all your digital needs. We are a leading React JS development company in India with time-tested expertise and an enriching work history, providing our clients with benefits, like
- 15+ years of industry experience to leverage
- Access to 400+ handpicked and pre-trained experienced developers
- On-demand onboarding of area experts in 48 hrs
- Remote-ready skills as per your time zones
- Employing efficient collaboration processes and tools for transparency
- Providing direct communication channels for all stakeholders
- 2x reduced delivery time with world-class ReactJS development services
- Domain expertise with clients from over 20+ countries
- Multi-skilled engineers who delivered 1000+ projects successfully
- 24/7 support and cutting-edge technological skills for maintenance
Can you help me complete my incomplete web or app development project?
Yes, we can certainly help you complete your development project at any stage that has remained unfinished for whatever reason. We understand the importance of your business-critical app development and can leverage our expertise to restart it with more vigor and skill. Our experts can pick up any process, wireframes, codes, or ideas and bring them to life in the shortest time. Connect with us now and discuss your needs with our experienced consultants to reopen your incomplete project with the best-fit solutions.
What expertise does your React developer have?
Our React architects utilize the popular framework to build highly interactive, extensible, and captivating applications for your specific requirements. They possess a wide range of React Developer Skills, such as
- Till the newest version React 19
- React customization
- HTML, CSS, JSX, & NPM
- Deep understanding of JavaScript Fundamentals
- W3C and ECMAScript standard coding
- Hands-on in Redux, Redux-Saga, React DnD, React Native, & Python
- Competent in Typescript, Swagger, Typeorm, Elastic, Pdfkit
- Expertise in using React with AWS, Firebase, Azure, and Lambda for React cloud solutions
- Skilled in TDD, BDD, Unit & manual testing
- Enterprise-level full-stack solutions
What are the key reasons for React's Popularity?
React is popular among developers for its speed, performance, and reusable UI components. Some key reasons include:
- It facilitates the building of interactive UIs through its component-based architecture. Components can be connected and reused easily.
- Building Apps with React is very fast, has excellent runtime performance, and uses system resources efficiently.
- Being maintained by Meta, it has a strong ReactJS community backing and a vast ecosystem of open-source libraries and tools.
- React makes it easy to manage state of even complex applications through its unidirectional data flow approach.
- Developers can build intuitive user interfaces incrementally using React Virtual DOM implementation.
- Code written for React is modular, reusable, and easy to maintain through concepts like separation of concerns.
What are the benefits of using React?
React is a dynamic and extremely popular front-end environment that creates immersive, flexible UI elements and front-ends for various interactive web applications. There numerous Proven benefits of ReactJS, such as
- Reusable code and React ForwardRef capabilities
- Write once, learn everywhere
- Enhanced user experience
- Optimized app performance and faster loading
- Mobile app development through React Native
- Extensive toolkits and extensions
- Easy to maintain web solutions
- Reliable developers’ tools
- Simple and SEO-friendly
- Document Object Model
- Best for enterprise-grade solutions
- Smooth compatibility with other frameworks & technologies
How does React JS app development reduce costs?
React JS reduces costs through reusable components and faster development cycles. Its efficient rendering and strong ecosystem also lower long-term maintenance and development effort.
How long does it take to develop a React.js web application?
A simple React.js application can take 4 to 8 weeks, while more complex applications may require 3 to 5 months, depending on features and scope.
Do you provide an NDA for the privacy of my project?
We make sure that your project is secured and that your data remains confidential in private Git until the end. To confirm that, we sign NDAs and IP rights, code documents, MoUs, or any other agreements. We ensure that you will have 100% ownership of your project.
Do you provide your clients with post-development support and maintenance?
Definitely, we back our clients with our comprehensive post-deployment services. Going beyond the Reactjs web app development processes, we provide 24/7 client support and maintenance to ensure your robust web solutions are updated and running seamlessly. So, you can depend on our end-to-end maintenance services as a trusted React development company.
How does eSparkBiz ensure the quality of my React projects?
At eSparkBiz, we follow agile methodology for all our projects, with robust development processes and testing for faster and smoother deployment. Also, our experts keep up with all the industry-best practices, compliances, and international coding standards, delivering the highest quality projects. Additionally, our QA experts and testers carefully analyze and perform manual and automated product testing at all stages, so you get error-free solutions with uncompromised performance, functionalities, and security.
Which are the top React development companies in 2026?
Top React development companies in 2026 include eSparkBiz, Icreon, MAS Global, Distillery, Custom D and U2i. These firms excel in delivering high-quality, scalable React applications, leveraging the latest tools and frameworks for innovative, user-centric solutions.


